ARMOUR Residential REIT, Inc. (ARR): Price and Financial Metrics
GET POWR RATINGS... FREE!
ARR POWR Grades
- Growth is the dimension where ARR ranks best; there it ranks ahead of 92.96% of US stocks.
- ARR's strongest trending metric is Growth; it's been moving up over the last 177 days.
- ARR ranks lowest in Sentiment; there it ranks in the 2nd percentile.
ARR Stock Summary
- The ratio of debt to operating expenses for ARMOUR RESIDENTIAL REIT INC is higher than it is for about 99.96% of US stocks.
- In terms of twelve month growth in earnings before interest and taxes, ARMOUR RESIDENTIAL REIT INC is reporting a growth rate of -1,518.65%; that's higher than merely 1.32% of US stocks.
- As for revenue growth, note that ARR's revenue has grown -482.07% over the past 12 months; that beats the revenue growth of merely 0.02% of US companies in our set.
- Stocks with similar financial metrics, market capitalization, and price volatility to ARMOUR RESIDENTIAL REIT INC are AGNC, NLY, FMCC, AGM, and NREF.
- ARR's SEC filings can be seen here. And to visit ARMOUR RESIDENTIAL REIT INC's official web site, go to www.armourreit.com.
ARR Valuation Summary
- ARR's price/earnings ratio is -3.8; this is 118.86% lower than that of the median Real Estate stock.
- Over the past 161 months, ARR's EV/EBIT ratio has gone up 4.5.
Below are key valuation metrics over time for ARR.
Stock | Date | P/S | P/B | P/E | EV/EBIT |
---|---|---|---|---|---|
ARR | 2023-03-23 | -4.8 | 0.8 | -3.8 | -33.3 |
ARR | 2023-03-22 | -4.8 | 0.8 | -3.8 | -33.4 |
ARR | 2023-03-21 | -4.9 | 0.8 | -3.9 | -33.4 |
ARR | 2023-03-20 | -4.8 | 0.8 | -3.8 | -33.4 |
ARR | 2023-03-17 | -4.8 | 0.8 | -3.8 | -33.3 |
ARR | 2023-03-16 | -5.0 | 0.9 | -4.0 | -33.6 |
ARR Growth Metrics
- The year over year cash and equivalents growth rate now stands at -1.27%.
- Its 5 year price growth rate is now at -66.94%.
- Its 4 year cash and equivalents growth rate is now at 212.21%.

The table below shows ARR's growth in key financial areas (numbers in millions of US dollars).
Date | Revenue | Operating Cash Flow | Net Income to Common Stock |
---|---|---|---|
2022-12-31 | -192.097 | 124.085 | -241.912 |
2022-09-30 | -252.634 | 4.021 | -302.094 |
2022-06-30 | -74.999 | -98.94 | -123.797 |
2022-03-31 | -86.35 | -93.163 | -134.38 |
2021-12-31 | 50.278 | 11.738 | 3.89 |
2021-09-30 | 150.284 | 61.495 | 106.751 |
ARR's Quality Factors
The “Quality” component of the POWR Ratings focuses on 31 different factors of a companies fundamentals and operational strength. Here are some key insights as we drill into the specifics of these quality attributes.- ARR has a Quality Grade of D, ranking ahead of 11.3% of graded US stocks.
- ARR's asset turnover comes in at 0.029 -- ranking 320th of 444 Trading stocks.
- AAIC, COHN, and OXSQ are the stocks whose asset turnover ratios are most correlated with ARR.
The table below shows ARR's key quality metrics over time.
Period | Asset Turnover | Gross Margin | ROIC |
---|---|---|---|
2021-09-30 | 0.029 | 0.861 | 0.013 |
2021-06-30 | 0.031 | 0.887 | 0.015 |
2021-03-31 | 0.052 | 0.937 | 0.027 |
2020-12-31 | -0.033 | 1.113 | -0.023 |
2020-09-30 | -0.021 | 1.154 | -0.014 |
2020-06-30 | -0.029 | 1.099 | -0.018 |
ARR Price Target
For more insight on analysts targets of ARR, see our ARR price target page. And for a list of of all stocks sorted by upside potential based on analyst target price, see our Top Price Target page.
Average Price Target | $11.06 | Average Broker Recommendation | 2 (Hold) |
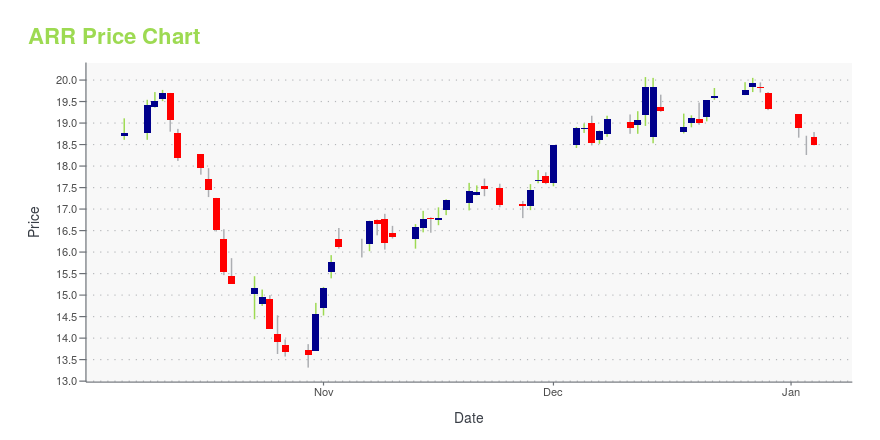
ARR Stock Price Chart Interactive Chart >
ARR Price/Volume Stats
Current price | $5.08 | 52-week high | $8.61 |
Prev. close | $5.07 | 52-week low | $4.38 |
Day low | $5.06 | Volume | 1,073,743 |
Day high | $5.15 | Avg. volume | 6,853,126 |
50-day MA | $5.60 | Dividend yield | 18.68% |
200-day MA | $6.08 | Market Cap | 977.80M |
ARMOUR Residential REIT, Inc. (ARR) Company Bio
ARMOUR Residential REIT, Inc. invests in and manages a portfolio of residential mortgage backed securities in the United States. Its securities portfolio primarily consists of agency securities backed by fixed rate, hybrid adjustable rate, and adjustable rate home loans, as well as unsecured notes and bonds issued by the government-sponsored entities and the United States treasuries; and money market instruments. The company was founded in 2008 and is based in Vero Beach, Florida.
Latest ARR News From Around the Web
Below are the latest news stories about ARMOUR RESIDENTIAL REIT INC that investors may wish to consider to help them evaluate ARR as an investment opportunity.
ARMOUR Residential REIT, Inc. (ARR) Is a Trending Stock: Facts to Know Before Betting on ItRecently, Zacks.com users have been paying close attention to Armour Residential REIT (ARR). This makes it worthwhile to examine what the stock has in store. |
ARMOUR Residential REIT, Inc. Announces Guidance for April 2023 Dividend Rate Per Common ShareVERO BEACH, Florida, March 27, 2023 (GLOBE NEWSWIRE) -- ARMOUR Residential REIT, Inc. (NYSE: ARR and ARR-PRC) (“ARMOUR” or the “Company”) today announced guidance on the April 2023 cash dividend for the Company's Common Stock of $0.08 per Common share. April 2023 Common Stock Dividend Information Month Dividend Holder of Record Date Payment DateApril 2023 $0.08 April 17, 2023 April 27, 2023 Certain Tax Matters ARMOUR has elected to be taxed as a real estate investment trust (“REIT”) for U.S. Fed |
Armour Residential REIT (ARR) Outpaces Stock Market Gains: What You Should KnowArmour Residential REIT (ARR) closed the most recent trading day at $4.88, moving +1.46% from the previous trading session. |
Investors Heavily Search ARMOUR Residential REIT, Inc. (ARR): Here is What You Need to KnowArmour Residential REIT (ARR) has been one of the stocks most watched by Zacks.com users lately. So, it is worth exploring what lies ahead for the stock. |
Armour Residential REIT (ARR) Dips More Than Broader Markets: What You Should KnowArmour Residential REIT (ARR) closed at $5.02 in the latest trading session, marking a -1.57% move from the prior day. |
ARR Price Returns
1-mo | -4.96% |
3-mo | -5.28% |
6-mo | 15.60% |
1-year | -27.67% |
3-year | -21.14% |
5-year | -59.51% |
YTD | -5.28% |
2022 | -32.01% |
2021 | 1.11% |
2020 | -33.13% |
2019 | -2.07% |
2018 | -11.97% |
ARR Dividends
Ex-Dividend Date | Type | Payout Amount | Change | ||||||
---|---|---|---|---|---|---|---|---|---|
Loading, please wait... |
Continue Researching ARR
Here are a few links from around the web to help you further your research on Armour Residential REIT Inc's stock as an investment opportunity:Armour Residential REIT Inc (ARR) Stock Price | Nasdaq
Armour Residential REIT Inc (ARR) Stock Quote, History and News - Yahoo Finance
Armour Residential REIT Inc (ARR) Stock Price and Basic Information | MarketWatch
Loading social stream, please wait...