
Asana, Inc. (ASAN): Price and Financial Metrics
ASAN Price/Volume Stats
| Current price | $15.37 | 52-week high | $24.81 |
| Prev. close | $15.08 | 52-week low | $11.29 |
| Day low | $15.12 | Volume | 1,646,500 |
| Day high | $15.52 | Avg. volume | 2,080,125 |
| 50-day MA | $13.79 | Dividend yield | N/A |
| 200-day MA | $16.90 | Market Cap | 3.51B |
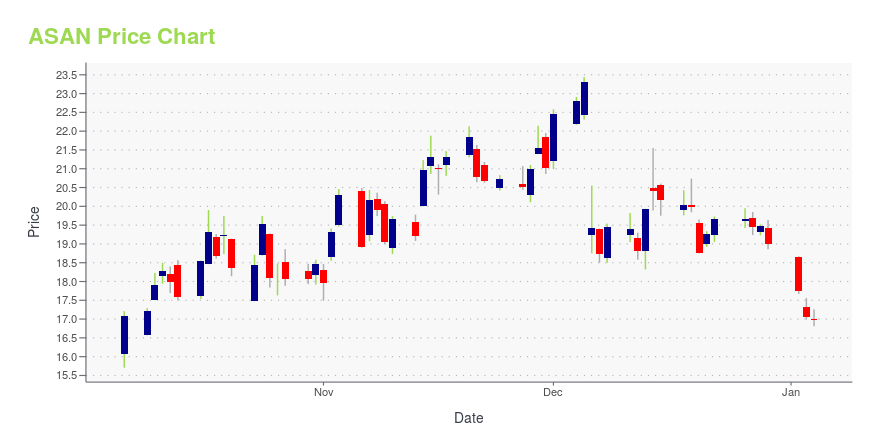
ASAN Stock Price Chart Interactive Chart >
Asana, Inc. (ASAN) Company Bio
Asana, Inc. operates a work management platform for individuals, team leads, and executives. It provides work management platform as software as service that enables individuals and teams to get work done faster while enhancing employee engagement by allowing everyone to see how their work connects to the broader mission of an organization. The company was formerly known as Smiley Abstractions, Inc. and changed its name to Asana, Inc. in July 2009. Asana, Inc. was founded in 2008 and is headquartered in San Francisco, California.
Latest ASAN News From Around the Web
Below are the latest news stories about ASANA INC that investors may wish to consider to help them evaluate ASAN as an investment opportunity.
Why Asana (ASAN) Stock Might be a Great PickAsana (ASAN) has seen solid earnings estimate revision activity over the past month, and belongs to a strong industry as well. |
Asana Inc COO Anne Raimondi Sells 17,045 SharesOn December 20, 2023, Asana Inc's (NYSE:ASAN) Chief Operating Officer, Anne Raimondi, sold 17,045 shares of the company's stock, according to a SEC Filing. |
Asana (ASAN) Expands Globally With New Office in PolandAsana (ASAN) opens an office in Warsaw, with the aim of bringing a new batch of smart and competent workers to its EMEA operations. |
11 Stocks Insiders and Billionaires Are Crazy AboutIn this article, we will take a detailed look at the 11 Stocks Insiders and Billionaires Are Crazy About. For a quick overview of such stocks, read our article 5 Stocks Insiders and Billionaires Are Crazy About. In his famous book titled One Up on Wall Street, Peter Lynch talks about how average investors miss out on opportunities by […] |
Asana Opens Office in Warsaw, PolandSAN FRANCISCO, December 19, 2023--Asana, a leading enterprise work management platform, today announced the opening of a new office location in Warsaw, Poland. This location will mark Asana’s 13th global office and sixth office within the EMEA region. New team members in Warsaw will focus on further developing strategic integrations between Asana’s platform and other enterprise tools. |
ASAN Price Returns
| 1-mo | 13.18% |
| 3-mo | 1.92% |
| 6-mo | -19.74% |
| 1-year | -34.18% |
| 3-year | -78.07% |
| 5-year | N/A |
| YTD | -19.15% |
| 2023 | 38.05% |
| 2022 | -81.53% |
| 2021 | 152.28% |
| 2020 | N/A |
| 2019 | N/A |
Loading social stream, please wait...