Ardmore Shipping Corporation (ASC): Price and Financial Metrics

Ardmore Shipping Corporation (ASC): $12.50

0.27 (-2.11%)

POWR Rating

Component Grades

Momentum

A

Stability

D

Sentiment

Quality

B

Add ASC to Watchlist
Sign Up

Industry: Shipping

Industry

B

Ranked

#20 of 44

in industry

ASC Price/Volume Stats

Current price $12.50 52-week high $19.41
Prev. close $12.77 52-week low $8.75
Day low $12.50 Volume 1,653
Day high $12.50 Avg. volume 777,610
50-day MA $12.94 Dividend yield 6.11%
200-day MA $14.04 Market Cap 533.13M

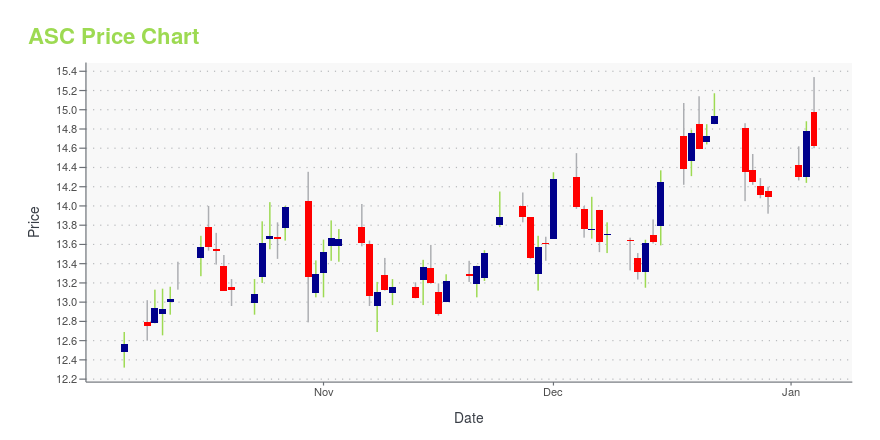
ASC Stock Price Chart Interactive Chart >

ASC POWR Grades

  • Momentum is the dimension where ASC ranks best; there it ranks ahead of 98.68% of US stocks.
  • The strongest trend for ASC is in Growth, which has been heading down over the past 178 days.
  • ASC's current lowest rank is in the Stability metric (where it is better than 11.63% of US stocks).

ASC Stock Summary

  • With a price/earnings ratio of 2.96, ARDMORE SHIPPING CORP P/E ratio is greater than that of about just 3.96% of stocks in our set with positive earnings.
  • Over the past twelve months, ASC has reported earnings growth of -1,228.55%, putting it ahead of only 1.51% of US stocks in our set.
  • ARDMORE SHIPPING CORP's shareholder yield -- a measure of how much capital is returned to stockholders via dividends and buybacks -- is 38.06%, greater than the shareholder yield of 95.83% of stocks in our set.
  • Stocks that are quantitatively similar to ASC, based on their financial statements, market capitalization, and price volatility, are EGLE, SLCA, SMHI, ESEA, and CXW.
  • Visit ASC's SEC page to see the company's official filings. To visit the company's web site, go to ardmoreshipping.com.

ASC Valuation Summary

  • ASC's price/sales ratio is 1.1; this is 45% lower than that of the median Industrials stock.
  • Over the past 122 months, ASC's price/sales ratio has gone down 8.6.

Below are key valuation metrics over time for ASC.

Stock Date P/S P/B P/E EV/EBIT
ASC 2023-07-27 1.1 1.1 2.9 3.1
ASC 2023-07-26 1.1 1.1 2.9 3.1
ASC 2023-07-25 1.1 1.1 2.8 3.1
ASC 2023-07-24 1.0 1.1 2.8 3.1
ASC 2023-07-21 1.0 1.0 2.7 2.9
ASC 2023-07-20 1.0 1.0 2.6 2.9

ASC Growth Metrics

    Its 4 year cash and equivalents growth rate is now at 42.5%.
  • The 4 year net income to common stockholders growth rate now stands at -39.35%.
  • Its 5 year net cashflow from operations growth rate is now at 19.29%.
Over the past 34 months, ASC's revenue has gone up $212,771,632.

The table below shows ASC's growth in key financial areas (numbers in millions of US dollars).

Date Revenue Operating Cash Flow Net Income to Common Stock
2022-12-31 445.741 124.207 135.054
2022-09-30 365.3691 62.88702 73.42099
2022-06-30 270.1519 5.67023 -0.384163
2022-03-31 210.301 -7.446411 -37.44024
2021-12-31 192.4843 -2.885404 -38.0867
2021-12-31 192.4843 -2.885404 -38.0867

ASC's Quality Factors

The “Quality” component of the POWR Ratings focuses on 31 different factors of a companies fundamentals and operational strength. Here are some key insights as we drill into the specifics of these quality attributes.
  • ASC has a Quality Grade of D, ranking ahead of 15.87% of graded US stocks.
  • ASC's asset turnover comes in at 0.242 -- ranking 80th of 137 Transportation stocks.
  • USAK, SNDR, and JBHT are the stocks whose asset turnover ratios are most correlated with ASC.

The table below shows ASC's key quality metrics over time.

Period Asset Turnover Gross Margin ROIC
2021-06-30 0.242 0.201 -0.026
2021-03-31 0.265 0.292 -0.004
2020-12-31 0.286 0.340 0.012
2020-12-31 0.286 0.340 0.012
2020-09-30 0.309 0.388 0.034
2020-06-30 0.318 0.386 0.037

ASC Price Target

For more insight on analysts targets of ASC, see our ASC price target page. And for a list of of all stocks sorted by upside potential based on analyst target price, see our Top Price Target page.

Average Price Target $5.06 Average Broker Recommendation 1.36 (Strong Buy)

Ardmore Shipping Corporation (ASC) Company Bio


Ardmore Shipping Corporation provides seaborne transportation of petroleum products and chemicals worldwide to oil majors, national oil companies, oil and chemical traders, and chemical companies, with its modern, fuel-efficient fleet of tankers. The company was founded in 2010 and is based in Hamilton, Bermuda.


ASC Latest News Stream


Event/Time News Detail
Loading, please wait...

ASC Latest Social Stream


Loading social stream, please wait...

View Full ASC Social Stream

Latest ASC News From Around the Web

Below are the latest news stories about ARDMORE SHIPPING CORP that investors may wish to consider to help them evaluate ASC as an investment opportunity.

Ardmore Shipping (ASC) Flat As Market Sinks: What You Should Know

In the latest trading session, Ardmore Shipping (ASC) closed at $12.44, marking no change from the previous day.

Yahoo | September 21, 2023

Is Weakness In Ardmore Shipping Corporation (NYSE:ASC) Stock A Sign That The Market Could be Wrong Given Its Strong Financial Prospects?

With its stock down 7.3% over the past month, it is easy to disregard Ardmore Shipping (NYSE:ASC). However, stock...

Yahoo | September 20, 2023

Are Investors Undervaluing Ardmore Shipping (ASC) Right Now?

Here at Zacks, our focus is on the proven Zacks Rank system, which emphasizes earnings estimates and estimate revisions to find great stocks. Nevertheless, we are always paying attention to the latest value, growth, and momentum trends to underscore strong picks.

Yahoo | September 19, 2023

Ardmore Shipping (ASC) Stock Moves -1.11%: What You Should Know

Ardmore Shipping (ASC) closed at $12.51 in the latest trading session, marking a -1.11% move from the prior day.

Yahoo | September 15, 2023

Investors Heavily Search Ardmore Shipping Corporation (ASC): Here is What You Need to Know

Zacks.com users have recently been watching Ardmore Shipping (ASC) quite a bit. Thus, it is worth knowing the facts that could determine the stock's prospects.

Yahoo | September 15, 2023

Read More 'ASC' Stories Here

ASC Price Returns

1-mo 0.21%
3-mo 7.79%
6-mo -15.17%
1-year 46.08%
3-year 342.59%
5-year 102.66%
YTD -7.24%
2022 326.33%
2021 3.36%
2020 -63.57%
2019 93.79%
2018 -41.62%

ASC Dividends

Ex-Dividend Date Type Payout Amount Change
Loading, please wait...
View Full ASC Dividend History

Get Free Updates

Join thousands of investors who get the latest news, insights and top rated picks from StockNews.com!