
AerSale Corporation (ASLE): Price and Financial Metrics
ASLE Price/Volume Stats
| Current price | $7.35 | 52-week high | $16.69 |
| Prev. close | $7.27 | 52-week low | $6.26 |
| Day low | $7.27 | Volume | 203,400 |
| Day high | $7.43 | Avg. volume | 482,420 |
| 50-day MA | $7.06 | Dividend yield | N/A |
| 200-day MA | $9.85 | Market Cap | 389.62M |
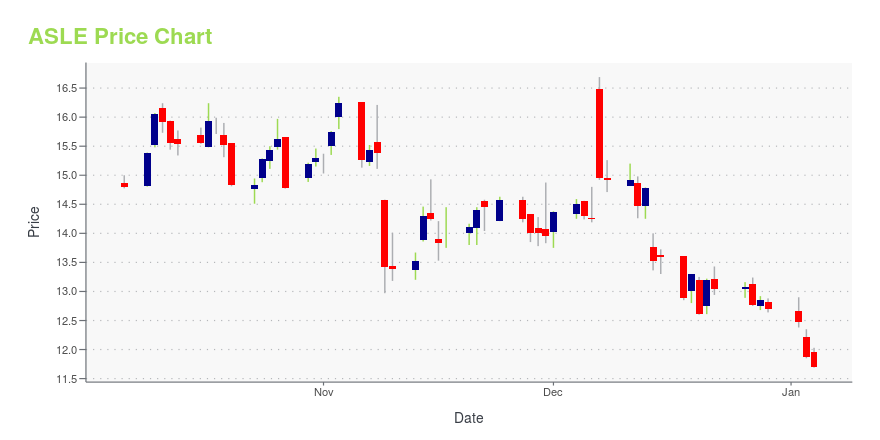
ASLE Stock Price Chart Interactive Chart >
AerSale Corporation (ASLE) Company Bio
AerSale Corporation provides aviation products and services. The Company offers after-market commercial jet aircraft, engines, and OEM used serviceable materials, as well as maintenance, repair, overhaul, and engineering services to passenger and cargo airlines, government entities, leasing companies, multinational OEMs, and independent MROs.
Latest ASLE News From Around the Web
Below are the latest news stories about AERSALE CORP that investors may wish to consider to help them evaluate ASLE as an investment opportunity.
AerSale Announces Pricing of Secondary Offering of Common StockCORAL GABLES, Fla., December 14, 2023--AerSale Corporation ("AerSale") (NASDAQ: ASLE), a leading provider of aviation products and services, today announced the pricing of the previously announced underwritten secondary offering (the "Offering") by affiliates of Leonard Green & Partners, L.P. (the "Selling Stockholders"), of 4,000,000 shares of common stock of AerSale pursuant to a shelf registration statement on Form S-3 filed by AerSale with the U.S. Securities and Exchange Commission (the "SE |
AerSale Announces Secondary Offering of Common StockCORAL GABLES, Fla., December 13, 2023--AerSale Corporation ("AerSale") (NASDAQ: ASLE), a leading provider of aviation products and services, today announced that certain of its stockholders, including affiliates of Leonard Green & Partners, L.P. (the "Selling Stockholders") intend to offer for sale in an underwritten secondary offering (the "Offering") 4,000,000 shares of common stock of AerSale pursuant to a shelf registration statement on Form S-3 filed by AerSale with the U.S. Securities and |
Today’s Biggest Pre-Market Stock Movers: 10 Top Gainers and Losers on ThursdayIt's time to start off Thursday with a breakdown of the biggest pre-market stock movers worth keeping an eye on this morning! |
AerSale® Receives Boeing 737NG Supplemental Type Certificate for its Enhanced Flight Vision System "AerAware™"CORAL GABLES, Fla., December 06, 2023--AerSale Corporation (NASDAQ: ASLE) ("AerSale", the "Company"), a leading provider of aviation products and services, announced today that the FAA has issued AerSale a Supplemental Type Certificate (STC) for "AerAware™", the Company’s revolutionary Enhanced Flight Vision System (EFVS) for the Boeing B737NG product line.1 This achievement marks the world's first commercial EFVS system2 to achieve a 50% visual advantage (over unaided natural vision) and the fi |
Capital Allocation Trends At AerSale (NASDAQ:ASLE) Aren't IdealFinding a business that has the potential to grow substantially is not easy, but it is possible if we look at a few key... |
ASLE Price Returns
| 1-mo | 12.73% |
| 3-mo | 5.91% |
| 6-mo | -26.72% |
| 1-year | -49.86% |
| 3-year | -34.90% |
| 5-year | N/A |
| YTD | -42.10% |
| 2023 | -21.73% |
| 2022 | -8.57% |
| 2021 | 32.29% |
| 2020 | 31.73% |
| 2019 | N/A |
Loading social stream, please wait...