Altisource Portfolio Solutions S.A. (ASPS): Price and Financial Metrics
ASPS Price/Volume Stats
Current price | $1.94 | 52-week high | $6.79 |
Prev. close | $1.95 | 52-week low | $1.77 |
Day low | $1.89 | Volume | 80,400 |
Day high | $2.07 | Avg. volume | 128,125 |
50-day MA | $2.74 | Dividend yield | N/A |
200-day MA | $3.95 | Market Cap | 51.55M |
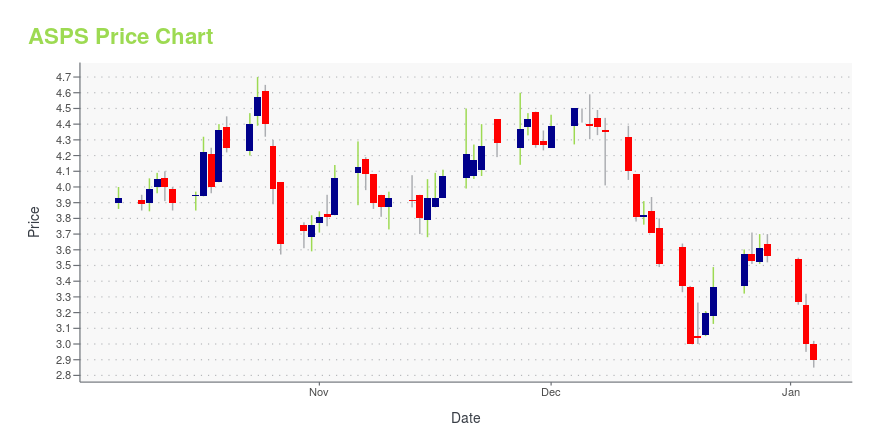
ASPS Stock Price Chart Interactive Chart >
ASPS POWR Grades
- Growth is the dimension where ASPS ranks best; there it ranks ahead of 85.06% of US stocks.
- The strongest trend for ASPS is in Stability, which has been heading up over the past 26 weeks.
- ASPS's current lowest rank is in the Value metric (where it is better than 22.61% of US stocks).
ASPS Stock Summary
- ALTISOURCE PORTFOLIO SOLUTIONS SA's capital turnover -- a measure of revenue relative to shareholder's equity -- is better than just 5.14% of US listed stocks.
- ASPS's equity multiplier -- a measure of assets relative to shareholders'equity -- is greater than that of only 5.61% of US stocks.
- In terms of twelve month growth in earnings before interest and taxes, ALTISOURCE PORTFOLIO SOLUTIONS SA is reporting a growth rate of -136.06%; that's higher than merely 9.83% of US stocks.
- Stocks with similar financial metrics, market capitalization, and price volatility to ALTISOURCE PORTFOLIO SOLUTIONS SA are TV, TROX, LAUR, NMIH, and HNNA.
- ASPS's SEC filings can be seen here. And to visit ALTISOURCE PORTFOLIO SOLUTIONS SA's official web site, go to www.altisource.com.
ASPS Valuation Summary
- ASPS's price/sales ratio is 0.6; this is 87.5% lower than that of the median Real Estate stock.
- ASPS's EV/EBIT ratio has moved down 24.9 over the prior 175 months.
Below are key valuation metrics over time for ASPS.
Stock | Date | P/S | P/B | P/E | EV/EBIT |
---|---|---|---|---|---|
ASPS | 2023-12-29 | 0.6 | -0.8 | -1.7 | -15.8 |
ASPS | 2023-12-28 | 0.7 | -0.8 | -1.8 | -15.9 |
ASPS | 2023-12-27 | 0.6 | -0.8 | -1.7 | -15.7 |
ASPS | 2023-12-26 | 0.6 | -0.8 | -1.7 | -15.8 |
ASPS | 2023-12-22 | 0.6 | -0.8 | -1.6 | -15.5 |
ASPS | 2023-12-21 | 0.6 | -0.7 | -1.6 | -15.2 |
ASPS Growth Metrics
- Its 3 year cash and equivalents growth rate is now at 55.22%.
- The 2 year cash and equivalents growth rate now stands at 1.08%.
- Its 4 year revenue growth rate is now at -39.23%.
The table below shows ASPS's growth in key financial areas (numbers in millions of US dollars).
Date | Revenue | Operating Cash Flow | Net Income to Common Stock |
---|---|---|---|
2022-09-30 | 157.021 | -51.565 | 28.484 |
2022-06-30 | 161.884 | -63.414 | 24.604 |
2022-03-31 | 167.504 | -60.505 | 21.624 |
2021-12-31 | 178.453 | -60.405 | 11.812 |
2021-09-30 | 199.715 | -49.457 | -65.954 |
2021-06-30 | 245.267 | -33.96 | -60.922 |
ASPS's Quality Factors
The “Quality” component of the POWR Ratings focuses on 31 different factors of a companies fundamentals and operational strength. Here are some key insights as we drill into the specifics of these quality attributes.- ASPS has a Quality Grade of C, ranking ahead of 34.53% of graded US stocks.
- ASPS's asset turnover comes in at 0.946 -- ranking 141st of 563 Business Services stocks.
- IT, SYNH, and TSSI are the stocks whose asset turnover ratios are most correlated with ASPS.
The table below shows ASPS's key quality metrics over time.
Period | Asset Turnover | Gross Margin | ROIC |
---|---|---|---|
2021-06-30 | 0.946 | 0.094 | -0.142 |
2021-03-31 | 1.030 | 0.115 | -0.181 |
2020-12-31 | 1.149 | 0.165 | -0.126 |
2020-09-30 | 1.282 | 0.204 | -0.128 |
2020-06-30 | 1.127 | 0.211 | -0.050 |
2020-03-31 | 1.098 | 0.227 | 0.047 |
ASPS Price Target
For more insight on analysts targets of ASPS, see our ASPS price target page. And for a list of of all stocks sorted by upside potential based on analyst target price, see our Top Price Target page.
Average Price Target | $15.00 | Average Broker Recommendation | 1.75 (Moderate Buy) |
Altisource Portfolio Solutions S.A. (ASPS) Company Bio
Altisource Portfolio Solutions operates as a marketplace and transaction solutions provider for the real estate, mortgage, and consumer debt industries in the United States. The company was founded in 1999 and is based in Luxembourg.
Latest ASPS News From Around the Web
Below are the latest news stories about ALTISOURCE PORTFOLIO SOLUTIONS SA that investors may wish to consider to help them evaluate ASPS as an investment opportunity.
15 Best Falling Stocks To Buy NowIn this article, we will take a detailed look at the 15 Best Falling Stocks To Buy Now. For a quick overview of such stocks, read our article 5 Best Falling Stocks To Buy Now. The Wall Street is headed to end 2023 on a strongly positive note as the Fed’s indication of coming rate cuts have infused a […] |
Hubzu Expands Collaboration with NCST (National Community Stabilization Trust) to Increase Access to Affordable HousingLUXEMBOURG, Nov. 30, 2023 (GLOBE NEWSWIRE) -- Altisource Portfolio Solutions S.A. (“Altisource” or the “Company”) (NASDAQ: ASPS), a leading provider and marketplace for the real estate and mortgage industries, today announced that Hubzu, Altisource’s industry leading online auction marketplace, has expanded its collaboration with NCST (National Community Stabilization Trust), a national nonprofit housing organization, to bolster the supply of affordable, single-family homes. This strategic colla |
Altisource Portfolio Solutions (NASDAQ:ASPS) investors are sitting on a loss of 81% if they invested five years agoAltisource Portfolio Solutions S.A. ( NASDAQ:ASPS ) shareholders should be happy to see the share price up 22% in the... |
Altisource Portfolio Solutions S.A. (NASDAQ:ASPS) Q3 2023 Earnings Call TranscriptAltisource Portfolio Solutions S.A. (NASDAQ:ASPS) Q3 2023 Earnings Call Transcript October 27, 2023 Operator: Good day. Welcome to the Altisource Third Quarter 2023 Earnings Conference Call. At this time all participants are in a listen-only mode. After the speakers’ presentation there will be a question-and-answer session. [Operator Instructions] Please be advised that today’s conference is […] |
Altisource Portfolio Solutions SA (ASPS) Announces Q3 2023 Financial ResultsCompany reports improved Adjusted EBITDA and significant debt reduction |
ASPS Price Returns
1-mo | -32.17% |
3-mo | -45.51% |
6-mo | -51.38% |
1-year | -58.37% |
3-year | -78.89% |
5-year | -91.80% |
YTD | -45.51% |
2023 | -62.37% |
2022 | -15.69% |
2021 | -12.89% |
2020 | -33.37% |
2019 | -14.05% |
Continue Researching ASPS
Want to see what other sources are saying about Altisource Portfolio Solutions SA's financials and stock price? Try the links below:Altisource Portfolio Solutions SA (ASPS) Stock Price | Nasdaq
Altisource Portfolio Solutions SA (ASPS) Stock Quote, History and News - Yahoo Finance
Altisource Portfolio Solutions SA (ASPS) Stock Price and Basic Information | MarketWatch
Loading social stream, please wait...