Altisource Portfolio Solutions S.A. (ASPS): Price and Financial Metrics
GET POWR RATINGS... FREE!
ASPS POWR Grades
- ASPS scores best on the Sentiment dimension, with a Sentiment rank ahead of 88.44% of US stocks.
- ASPS's strongest trending metric is Stability; it's been moving up over the last 179 days.
- ASPS's current lowest rank is in the Value metric (where it is better than 26.22% of US stocks).
ASPS Stock Summary
- Altisource Portfolio Solutions Sa's capital turnover -- a measure of revenue relative to shareholder's equity -- is better than merely 3% of US listed stocks.
- Of note is the ratio of Altisource Portfolio Solutions Sa's sales and general administrative expense to its total operating expenses; merely 0.05% of US stocks have a lower such ratio.
- For ASPS, its debt to operating expenses ratio is greater than that reported by merely 0.19% of US equities we're observing.
- Stocks with similar financial metrics, market capitalization, and price volatility to Altisource Portfolio Solutions Sa are RDI, SID, FNV, WPM, and FSP.
- Visit ASPS's SEC page to see the company's official filings. To visit the company's web site, go to www.altisource.com.
ASPS Valuation Summary
- In comparison to the median Financial Services stock, ASPS's price/sales ratio is 84.38% lower, now standing at 0.5.
- Over the past 147 months, ASPS's price/sales ratio has gone down 0.6.
- Over the past 147 months, ASPS's EV/EBIT ratio has gone down 17.8.
Below are key valuation metrics over time for ASPS.
Stock | Date | P/S | P/B | P/E | EV/EBIT |
---|---|---|---|---|---|
ASPS | 2021-03-25 | 0.4 | -1.6 | -2.0 | -7.8 |
ASPS | 2019-01-17 | 0.5 | 1.3 | 1.4 | 17.2 |
ASPS | 2017-10-19 | 0.5 | 7.4 | 82.7 | 19.6 |
ASPS | 2016-09-23 | 0.5 | 8.6 | 18.9 | 14.1 |
ASPS | 2013-12-24 | 5.3 | 21.1 | 29.1 | 26.0 |
ASPS | 2011-04-25 | 2.7 | 5.4 | 16.4 | 16.1 |
ASPS Growth Metrics
- Its 5 year cash and equivalents growth rate is now at -50.47%.
- The 5 year net cashflow from operations growth rate now stands at -78.49%.
- The 4 year revenue growth rate now stands at -43.44%.

The table below shows ASPS's growth in key financial areas (numbers in millions of US dollars).
Date | Revenue | Operating Cash Flow | Net Income to Common Stock |
---|---|---|---|
2021-12-31 | 178.453 | -60.405 | 11.812 |
2021-09-30 | 199.715 | -49.457 | -65.954 |
2021-06-30 | 245.267 | -33.96 | -60.922 |
2021-03-31 | 294.568 | -37.563 | -77.508 |
2020-12-31 | 365.547 | -22.401 | -67.156 |
2020-09-30 | 446.269 | 10.417 | -366.054 |
ASPS's Quality Factors
The “Quality” component of the POWR Ratings focuses on 31 different factors of a companies fundamentals and operational strength. Here are some key insights as we drill into the specifics of these quality attributes.- ASPS has a Quality Grade of C, ranking ahead of 34.53% of graded US stocks.
- ASPS's asset turnover comes in at 0.946 -- ranking 141st of 563 Business Services stocks.
- IT, SYNH, and TSSI are the stocks whose asset turnover ratios are most correlated with ASPS.
The table below shows ASPS's key quality metrics over time.
Period | Asset Turnover | Gross Margin | ROIC |
---|---|---|---|
2021-06-30 | 0.946 | 0.094 | -0.142 |
2021-03-31 | 1.030 | 0.115 | -0.181 |
2020-12-31 | 1.149 | 0.165 | -0.126 |
2020-09-30 | 1.282 | 0.204 | -0.128 |
2020-06-30 | 1.127 | 0.211 | -0.050 |
2020-03-31 | 1.098 | 0.227 | 0.047 |
ASPS Price Target
For more insight on analysts targets of ASPS, see our ASPS price target page. And for a list of of all stocks sorted by upside potential based on analyst target price, see our Top Price Target page.
Average Price Target | $15.00 | Average Broker Recommendation | 1.75 (Moderate Buy) |
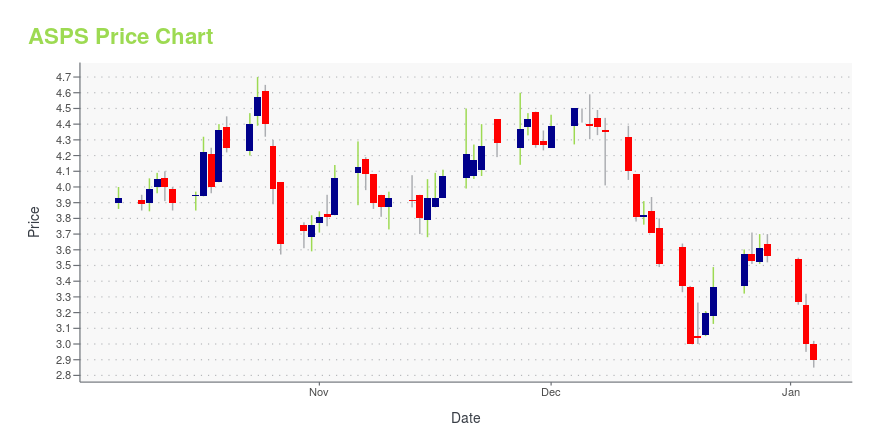
ASPS Stock Price Chart Interactive Chart >
ASPS Price/Volume Stats
Current price | $11.27 | 52-week high | $14.58 |
Prev. close | $10.85 | 52-week low | $6.36 |
Day low | $10.58 | Volume | 207,450 |
Day high | $11.59 | Avg. volume | 49,839 |
50-day MA | $11.07 | Dividend yield | N/A |
200-day MA | $11.26 | Market Cap | 180.96M |
Altisource Portfolio Solutions S.A. (ASPS) Company Bio
Altisource Portfolio Solutions operates as a marketplace and transaction solutions provider for the real estate, mortgage, and consumer debt industries in the United States. The company was founded in 1999 and is based in Luxembourg.
Latest ASPS News From Around the Web
Below are the latest news stories about Altisource Portfolio Solutions Sa that investors may wish to consider to help them evaluate ASPS as an investment opportunity.
Altisource Portfolio Solutions S.A. Schedules Fourth Quarter 2021 Conference CallLUXEMBOURG, Feb. 17, 2022 (GLOBE NEWSWIRE) -- On Thursday, March 3, 2022, Altisource Portfolio Solutions S.A. (“Altisource”) (NASDAQ: ASPS) will report earnings for the fourth quarter and full year 2021. A press release and presentation will be available on Altisource’s website in the Investor Relations section. Altisource will also host a conference call at 8:30 a.m. EST on the same day to discuss its fourth quarter and full year 2021 results. A link to the live audio webcast will be available |
Do Insiders Own Lots Of Shares In Altisource Portfolio Solutions S.A. (NASDAQ:ASPS)?The big shareholder groups in Altisource Portfolio Solutions S.A. ( NASDAQ:ASPS ) have power over the company... |
Analysts Expect Breakeven For Altisource Portfolio Solutions S.A. (NASDAQ:ASPS) Before LongAltisource Portfolio Solutions S.A. ( NASDAQ:ASPS ) is possibly approaching a major achievement in its business, so we... |
Altisource Announces the Completion of the Sale of Its Pointillist SubsidiaryAltisource Received $102.2 Million in Cash at Closing and Anticipates Receiving $3.5 Million in Cash Following the One-Year Anniversary of ClosingLUXEMBOURG, Dec. 01, 2021 (GLOBE NEWSWIRE) -- Altisource Portfolio Solutions S.A. (“Altisource” or the “Company”) (NASDAQ: ASPS) today announced that the shareholders of Pointillist, Inc. (“Pointillist”), a majority owned subsidiary of Altisource, closed on the previously announced transaction to sell all of the equity interests in Pointillist to Genes |
SFRhub.com Signs Technology Integration MOU with Altisource Creating SFR Investment Industry’s Leading Single-Source Transactional PlatformPHOENIX & LUXEMBOURG, November 29, 2021--SFRhub.com and Altisource to create fully integrated acquisition/disposition digital platform streamlining CRE transactional investment process. |
ASPS Price Returns
1-mo | 5.33% |
3-mo | -9.41% |
6-mo | -6.08% |
1-year | 72.59% |
3-year | -49.57% |
5-year | -46.74% |
YTD | 0.45% |
2021 | -12.89% |
2020 | -33.37% |
2019 | -14.05% |
2018 | -19.68% |
2017 | 5.30% |
Continue Researching ASPS
Want to see what other sources are saying about Altisource Portfolio Solutions SA's financials and stock price? Try the links below:Altisource Portfolio Solutions SA (ASPS) Stock Price | Nasdaq
Altisource Portfolio Solutions SA (ASPS) Stock Quote, History and News - Yahoo Finance
Altisource Portfolio Solutions SA (ASPS) Stock Price and Basic Information | MarketWatch
Loading social stream, please wait...