
A10 Networks, Inc. (ATEN): Price and Financial Metrics
ATEN Price/Volume Stats
| Current price | $14.25 | 52-week high | $16.46 |
| Prev. close | $14.11 | 52-week low | $10.03 |
| Day low | $14.00 | Volume | 490,309 |
| Day high | $14.29 | Avg. volume | 771,827 |
| 50-day MA | $14.23 | Dividend yield | 1.73% |
| 200-day MA | $13.34 | Market Cap | 1.06B |
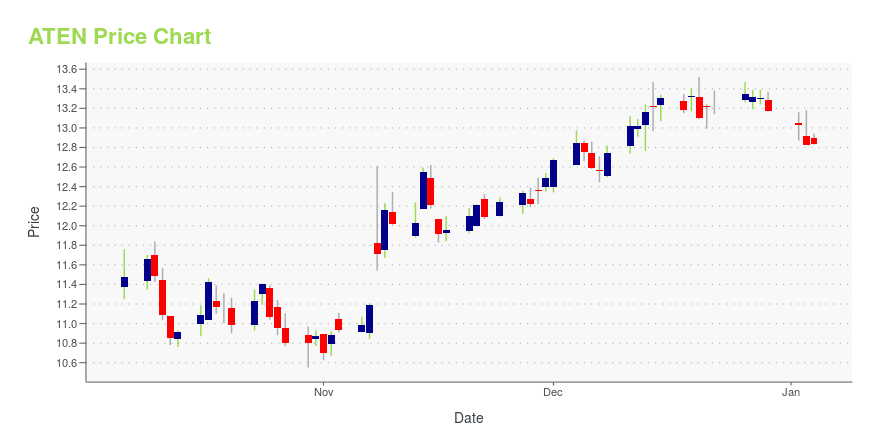
ATEN Stock Price Chart Interactive Chart >
A10 Networks, Inc. (ATEN) Company Bio
A10 Networks provides application delivery controllers for optimizing data center performance, carrier grade networking products that offer address and protocol translation services for service provider networks, and a distributed denial of service threat protection system for network-wide security protection. The company was founded in 2004 and is based in San Jose, California.
Latest ATEN News From Around the Web
Below are the latest news stories about A10 NETWORKS INC that investors may wish to consider to help them evaluate ATEN as an investment opportunity.
7 Cybersecurity Stocks to Exit ASAPCybersecurity is a fast-growing business, but not everyone can be a winner in this competitive space. |
Could The Market Be Wrong About A10 Networks, Inc. (NYSE:ATEN) Given Its Attractive Financial Prospects?With its stock down 15% over the past three months, it is easy to disregard A10 Networks (NYSE:ATEN). However, stock... |
Insider Sell: CEO Dhrupad Trivedi Sells 15,729 Shares of A10 Networks Inc (ATEN)In a notable insider transaction, CEO Dhrupad Trivedi sold 15,729 shares of A10 Networks Inc (NYSE:ATEN) on December 6, 2023. |
A10 Networks, Inc. (NYSE:ATEN) Looks Interesting, And It's About To Pay A DividendA10 Networks, Inc. ( NYSE:ATEN ) is about to trade ex-dividend in the next three days. The ex-dividend date occurs one... |
A10 Networks (NYSE:ATEN) Has Affirmed Its Dividend Of $0.06The board of A10 Networks, Inc. ( NYSE:ATEN ) has announced that it will pay a dividend on the 1st of December, with... |
ATEN Price Returns
| 1-mo | 7.79% |
| 3-mo | 5.65% |
| 6-mo | 4.21% |
| 1-year | -5.85% |
| 3-year | 33.35% |
| 5-year | 99.04% |
| YTD | 9.12% |
| 2023 | -19.43% |
| 2022 | 1.70% |
| 2021 | 68.66% |
| 2020 | 43.52% |
| 2019 | 10.10% |
ATEN Dividends
| Ex-Dividend Date | Type | Payout Amount | Change | ||||||
|---|---|---|---|---|---|---|---|---|---|
| Loading, please wait... | |||||||||
Continue Researching ATEN
Here are a few links from around the web to help you further your research on A10 Networks Inc's stock as an investment opportunity:A10 Networks Inc (ATEN) Stock Price | Nasdaq
A10 Networks Inc (ATEN) Stock Quote, History and News - Yahoo Finance
A10 Networks Inc (ATEN) Stock Price and Basic Information | MarketWatch
Loading social stream, please wait...