
ATN International, Inc. (ATNI): Price and Financial Metrics
ATNI Price/Volume Stats
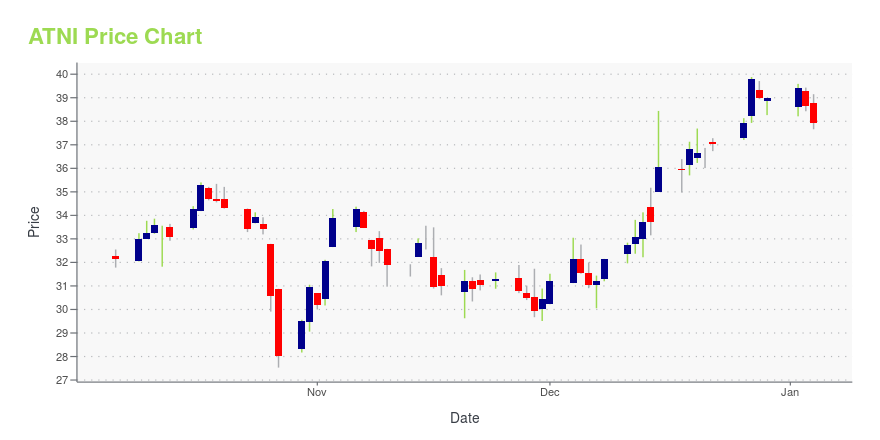
| Current price | $27.56 | 52-week high | $39.88 |
| Prev. close | $26.07 | 52-week low | $18.20 |
| Day low | $26.49 | Volume | 114,600 |
| Day high | $27.82 | Avg. volume | 127,862 |
| 50-day MA | $23.03 | Dividend yield | 4.22% |
| 200-day MA | $29.93 | Market Cap | 422.14M |
ATNI Stock Price Chart Interactive Chart >
ATN International, Inc. (ATNI) Company Bio
Atlantic Tele-Network changes its name to provides telecommunications services to rural, niche and other underserved markets and geographies in the United States, Bermuda and the Caribbean and owns and operates solar power systems in select locations in the United States. The company provides telecommunications services to rural, niche and other underserved markets and geographies in the United States, Bermuda and the Caribbean and owns and operates solar power systems in select locations in the United States.
Latest ATNI News From Around the Web
Below are the latest news stories about ATN INTERNATIONAL INC that investors may wish to consider to help them evaluate ATNI as an investment opportunity.
ATN International Announces Dividend & Share Buyout HikeThe balanced capital allocation strategy signifies the prudent investment decisions and healthy debt position of ATN International (ATNI). |
ATN International Board of Directors Expands Share Repurchase Program to $25 Million and Increases Dividend by 14%BEVERLY, Mass., Dec. 14, 2023 (GLOBE NEWSWIRE) -- ATN International, Inc. (“ATN” or the “Company”) (Nasdaq: ATNI), today announced that the Company’s Board of Directors has authorized the expansion of the share repurchase program to $25 million of common stock and approved a quarterly dividend increase of 14% to $0.24 from $0.21 per share. The quarterly dividend will be payable on January 5, 2024, on all common shares outstanding to stockholders of record as of December 31, 2023. “As we approach |
Independent Director of ATN International Pamela Lenehan Buys 86% More SharesPotential ATN International, Inc. ( NASDAQ:ATNI ) shareholders may wish to note that the Independent Director, Pamela... |
McConnell Named President and CEO of Alaska CommunicationsANCHORAGE, Alaska, November 20, 2023--The Alaska Communications board of directors has named Matthew (Matt) McConnell president and chief executive officer. McConnell is an accomplished CEO, COO, entrepreneur, community leader, board chairman, independent director and Fortune 50 executive with more than three decades of experience driving profitable growth in technology companies. He brings a unique combination of entrepreneurial and corporate experience to Alaska Communications. |
ATN Announces Leadership Succession Plan for 2024CEO Michael Prior to Transition to Executive Chairman;COO Brad Martin to be Appointed Chief Executive Officer and Member of the Board;Justin Benincasa to Retire; Carlos Doglioli to be Named CFO BEVERLY, Mass., Nov. 15, 2023 (GLOBE NEWSWIRE) -- ATN International, Inc. (“ATN” or the “Company”) (Nasdaq: ATNI), today announced that Chief Operating Officer Brad Martin will succeed Michael Prior as President and Chief Executive Officer of ATN effective January 1, 2024, and join the board of directors. |
ATNI Price Returns
| 1-mo | 26.04% |
| 3-mo | 42.70% |
| 6-mo | -25.67% |
| 1-year | -21.80% |
| 3-year | -32.88% |
| 5-year | -47.79% |
| YTD | -27.96% |
| 2023 | -11.92% |
| 2022 | 15.34% |
| 2021 | -2.88% |
| 2020 | -23.59% |
| 2019 | -21.63% |
ATNI Dividends
| Ex-Dividend Date | Type | Payout Amount | Change | ||||||
|---|---|---|---|---|---|---|---|---|---|
| Loading, please wait... | |||||||||
Continue Researching ATNI
Want to see what other sources are saying about ATN International Inc's financials and stock price? Try the links below:ATN International Inc (ATNI) Stock Price | Nasdaq
ATN International Inc (ATNI) Stock Quote, History and News - Yahoo Finance
ATN International Inc (ATNI) Stock Price and Basic Information | MarketWatch
Loading social stream, please wait...