Athenex, Inc. (ATNX): Price and Financial Metrics
GET POWR RATINGS... FREE!
ATNX POWR Grades
- ATNX scores best on the Growth dimension, with a Growth rank ahead of 87.56% of US stocks.
- The strongest trend for ATNX is in Value, which has been heading down over the past 33 days.
- ATNX ranks lowest in Quality; there it ranks in the 5th percentile.
ATNX Stock Summary
- ATHENEX INC's capital turnover -- a measure of revenue relative to shareholder's equity -- is better than merely 1.21% of US listed stocks.
- With a price/sales ratio of 0.09, ATHENEX INC has a higher such ratio than only 1.82% of stocks in our set.
- In terms of volatility of its share price, ATNX is more volatile than 99.43% of stocks we're observing.
- Stocks that are quantitatively similar to ATNX, based on their financial statements, market capitalization, and price volatility, are KPTI, ALNY, DBX, GDDY, and ESPR.
- ATNX's SEC filings can be seen here. And to visit ATHENEX INC's official web site, go to www.athenex.com.
ATNX Valuation Summary
- ATNX's EV/EBIT ratio is -0.6; this is 109.16% lower than that of the median Healthcare stock.
- ATNX's price/earnings ratio has moved up 7.8 over the prior 70 months.
Below are key valuation metrics over time for ATNX.
Stock | Date | P/S | P/B | P/E | EV/EBIT |
---|---|---|---|---|---|
ATNX | 2023-03-17 | 0.1 | 0.6 | -0.1 | -0.6 |
ATNX | 2023-03-16 | 0.1 | 0.6 | -0.1 | -0.6 |
ATNX | 2023-03-15 | 0.1 | 0.6 | -0.1 | -0.6 |
ATNX | 2023-03-14 | 0.1 | 0.6 | -0.1 | -0.6 |
ATNX | 2023-03-13 | 0.1 | 0.6 | -0.1 | -0.6 |
ATNX | 2023-03-10 | 0.1 | 0.6 | -0.1 | -0.6 |
ATNX's Quality Factors
The “Quality” component of the POWR Ratings focuses on 31 different factors of a companies fundamentals and operational strength. Here are some key insights as we drill into the specifics of these quality attributes.- ATNX has a Quality Grade of F, ranking ahead of 2.45% of graded US stocks.
- ATNX's asset turnover comes in at 0.31 -- ranking 148th of 681 Pharmaceutical Products stocks.
- XNCR, DRRX, and VRTX are the stocks whose asset turnover ratios are most correlated with ATNX.
The table below shows ATNX's key quality metrics over time.
Period | Asset Turnover | Gross Margin | ROIC |
---|---|---|---|
2021-06-30 | 0.310 | 0.344 | -0.445 |
2021-03-31 | 0.384 | 0.334 | -0.479 |
2020-12-31 | 0.416 | 0.340 | -0.548 |
2020-09-30 | 0.477 | 0.409 | -0.574 |
2020-06-30 | 0.472 | 0.394 | -0.716 |
2020-03-31 | 0.404 | 0.436 | -0.726 |
ATNX Price Target
For more insight on analysts targets of ATNX, see our ATNX price target page. And for a list of of all stocks sorted by upside potential based on analyst target price, see our Top Price Target page.
Average Price Target | $9.17 | Average Broker Recommendation | 1.71 (Moderate Buy) |
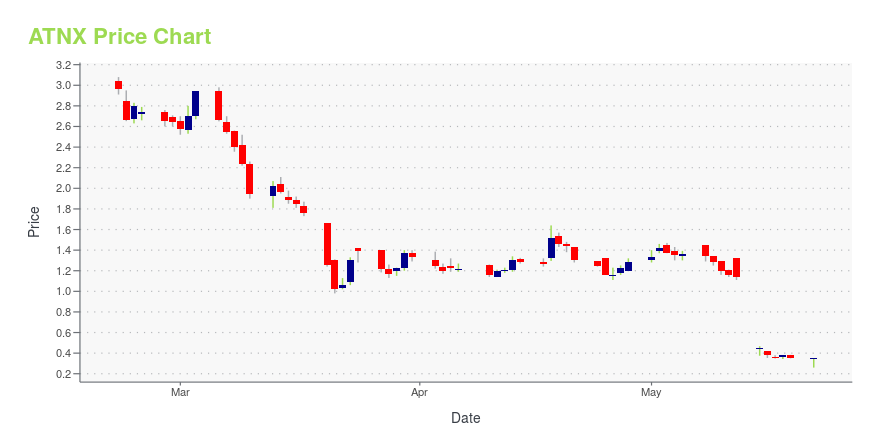
ATNX Stock Price Chart Interactive Chart >
ATNX Price/Volume Stats
Current price | $1.39 | 52-week high | $23.80 |
Prev. close | $1.30 | 52-week low | $0.98 |
Day low | $1.28 | Volume | 140,200 |
Day high | $1.42 | Avg. volume | 122,633 |
50-day MA | $3.05 | Dividend yield | N/A |
200-day MA | $6.16 | Market Cap | 12.04M |
Athenex, Inc. (ATNX) Company Bio
Athenex Inc. is a global biopharmaceutical company dedicated to the discovery, development and commercialization of novel therapies for the treatment of cancer. The company was founded in 2003 and is based in Buffalo, New York.
Latest ATNX News From Around the Web
Below are the latest news stories about ATHENEX INC that investors may wish to consider to help them evaluate ATNX as an investment opportunity.
Athenex (ATNX) Upgraded to Buy: Here's WhyAthenex (ATNX) has been upgraded to a Zacks Rank #2 (Buy), reflecting growing optimism about the company's earnings prospects. This might drive the stock higher in the near term. |
Athenex GAAP EPS of -$4.28, revenue of $25.06M
|
Athenex phase 1 neuroblastoma candidate trial hit by patient death; down 28%
|
Athenex Provides Fourth Quarter and Full Year 2022 Financial Results and Business UpdateExploring a range of strategic alternatives Revenues from product sales from continued operations increased +27% Y/Y in 4Q 2022 and +33% for full year 2022 Net Loss attributable to Athenex was $34.2 million, or $4.28 per diluted share in 4Q2022, compared to $104.4 million, or $19.08 per diluted share, in the prior year quarter Cash, cash equivalents, and restricted cash balance of $35.6 million at year end Additional Phase 1 dose escalation study safety and preliminary efficacy data for KUR-502 |
Today’s Biggest Pre-Market Stock Movers: 10 Top Gainers and Losers on ThursdayIt's time to start the day with an overview of the biggest pre-market stock movers worth keeping an eye on Thursday morning! |
ATNX Price Returns
1-mo | -50.36% |
3-mo | -55.13% |
6-mo | -73.13% |
1-year | -92.31% |
3-year | -99.13% |
5-year | -99.55% |
YTD | -52.88% |
2022 | -89.15% |
2021 | -87.70% |
2020 | -27.57% |
2019 | 20.33% |
2018 | -20.19% |
Continue Researching ATNX
Want to do more research on Athenex Inc's stock and its price? Try the links below:Athenex Inc (ATNX) Stock Price | Nasdaq
Athenex Inc (ATNX) Stock Quote, History and News - Yahoo Finance
Athenex Inc (ATNX) Stock Price and Basic Information | MarketWatch
Loading social stream, please wait...