AptarGroup, Inc. (ATR): Price and Financial Metrics

AptarGroup, Inc. (ATR): $113.36

-0.80 (-0.70%)

POWR Rating

Component Grades

Momentum

C

Stability

A

Sentiment

Quality

B

Add ATR to Watchlist
Sign Up

Industry: Industrial - Packaging

Industry

B

Ranked

#5 of 22

in industry

ATR Price/Volume Stats

Current price $113.36 52-week high $122.50
Prev. close $114.16 52-week low $90.23
Day low $113.01 Volume 136,000
Day high $114.72 Avg. volume 218,583
50-day MA $117.79 Dividend yield 1.33%
200-day MA $109.54 Market Cap 7.41B

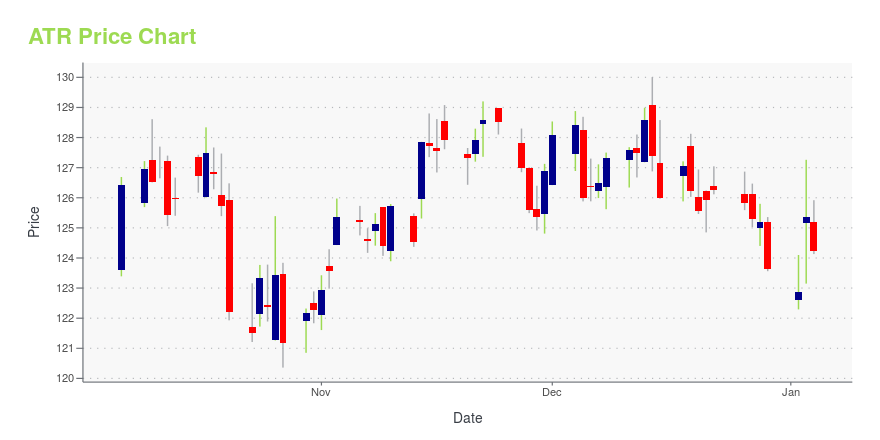
ATR Stock Price Chart Interactive Chart >

ATR POWR Grades

  • Stability is the dimension where ATR ranks best; there it ranks ahead of 97% of US stocks.
  • ATR's strongest trending metric is Quality; it's been moving up over the last 179 days.
  • ATR's current lowest rank is in the Value metric (where it is better than 7.4% of US stocks).

ATR Stock Summary

  • APTARGROUP INC's market capitalization of $7,542,828,518 is ahead of 81.69% of US-listed equities.
  • ATR's one year PEG ratio, measuring expected growth in earnings next year relative to current common stock price is 467.91 -- higher than 94.53% of US-listed equities with positive expected earnings growth.
  • In terms of volatility of its share price, ATR is more volatile than merely 14.34% of stocks we're observing.
  • Stocks that are quantitatively similar to ATR, based on their financial statements, market capitalization, and price volatility, are SHO, DY, MKTX, HCCI, and ACHC.
  • ATR's SEC filings can be seen here. And to visit APTARGROUP INC's official web site, go to www.aptar.com.

ATR Valuation Summary

  • ATR's EV/EBIT ratio is 21.9; this is 58.12% higher than that of the median Consumer Cyclical stock.
  • ATR's price/sales ratio has moved up 1 over the prior 243 months.

Below are key valuation metrics over time for ATR.

Stock Date P/S P/B P/E EV/EBIT
ATR 2023-05-19 2.3 3.7 33.7 21.9
ATR 2023-05-18 2.3 3.7 33.7 21.9
ATR 2023-05-17 2.3 3.7 33.7 21.9
ATR 2023-05-16 2.3 3.7 33.5 21.7
ATR 2023-05-15 2.4 3.7 34.1 22.2
ATR 2023-05-12 2.4 3.7 34.2 22.2

ATR Growth Metrics

    The 4 year net cashflow from operations growth rate now stands at 46.47%.
  • Its 2 year revenue growth rate is now at 16.17%.
  • Its 3 year cash and equivalents growth rate is now at 63.6%.
ATR's revenue has moved up $485,424,000 over the prior 34 months.

The table below shows ATR's growth in key financial areas (numbers in millions of US dollars).

Date Revenue Operating Cash Flow Net Income to Common Stock
2022-12-31 3,322.249 478.617 239.288
2022-09-30 3,340.328 410.419 237.901
2022-06-30 3,328.91 364.516 230.917
2022-03-31 3,295.399 383.335 222.568
2021-12-31 3,227.221 363.443 244.097
2021-09-30 3,162.557 448.099 239.72

ATR's Quality Factors

The “Quality” component of the POWR Ratings focuses on 31 different factors of a companies fundamentals and operational strength. Here are some key insights as we drill into the specifics of these quality attributes.
  • ATR has a Quality Grade of B, ranking ahead of 86.1% of graded US stocks.
  • ATR's asset turnover comes in at 0.78 -- ranking 10th of 22 Rubber and Plastic Products stocks.
  • BERY, WMS, and CTIB are the stocks whose asset turnover ratios are most correlated with ATR.

The table below shows ATR's key quality metrics over time.

Period Asset Turnover Gross Margin ROIC
2021-09-30 0.780 0.362 0.180
2021-06-30 0.776 0.366 0.196
2021-03-31 0.762 0.370 0.194
2020-12-31 0.759 0.371 0.185
2020-09-30 0.760 0.366 0.185
2020-06-30 0.764 0.365 0.184

ATR Price Target

For more insight on analysts targets of ATR, see our ATR price target page. And for a list of of all stocks sorted by upside potential based on analyst target price, see our Top Price Target page.

Average Price Target $153.86 Average Broker Recommendation 1.75 (Moderate Buy)

AptarGroup, Inc. (ATR) Company Bio


AptarGroup Inc. is a supplier of a broad range of innovative dispensing solutions for the beauty, personal care, home care, prescription drug, consumer health care, injectables, food, and beverage markets. The company was founded in 1992 and is based in Crystal Lake, Illinois.


ATR Latest News Stream


Event/Time News Detail
Loading, please wait...

ATR Latest Social Stream


Loading social stream, please wait...

View Full ATR Social Stream

Latest ATR News From Around the Web

Below are the latest news stories about APTARGROUP INC that investors may wish to consider to help them evaluate ATR as an investment opportunity.

Manitowoc (MTW) Up 63% in 6 Months: Will the Trend Continue?

Manitowoc (MTW) is gaining on the back of its improving demand, pricing actions and cost-saving efforts which have been driving earnings growth.

Yahoo | May 22, 2023

New Strong Buy Stocks for May 22nd

DHC, BAMXF, MAR, ATR and RYI have been added to the Zacks Rank #1 (Strong Buy) List on May 22, 2023.

Yahoo | May 22, 2023

Deere (DE) Q2 Earnings & Revenues Top Estimates, '23 View Raised

Deere (DE) second-quarter results reflect benefits from higher shipment volumes and price realization.

Yahoo | May 19, 2023

Reasons to Add Terex (TEX) Stock to Your Portfolio Now

Terex (TEX) is likely to continue gaining from the solid backlog levels, ongoing momentum in both its segments, focus on strategic growth policies and cost-control measures.

Yahoo | May 19, 2023

O-I Glass (OI) Up 48% in a Year: What's Driving the Stock?

O-I Glass (OI) has been gaining on incremental net price realization and strong operating and cost performance. Rising demand for glass as a packaging option will continue to drive momentum.

Yahoo | May 18, 2023

Read More 'ATR' Stories Here

ATR Price Returns

1-mo -6.51%
3-mo -4.10%
6-mo 5.59%
1-year 7.35%
3-year 5.67%
5-year 30.18%
YTD 3.74%
2022 -8.93%
2021 -9.54%
2020 19.87%
2019 24.47%
2018 10.55%

ATR Dividends

Ex-Dividend Date Type Payout Amount Change
Loading, please wait...
View Full ATR Dividend History

Get Free Updates

Join thousands of investors who get the latest news, insights and top rated picks from StockNews.com!