
Atara Biotherapeutics, Inc. (ATRA): Price and Financial Metrics
ATRA Price/Volume Stats
| Current price | $10.17 | 52-week high | $63.38 |
| Prev. close | $9.76 | 52-week low | $4.96 |
| Day low | $9.67 | Volume | 30,400 |
| Day high | $10.18 | Avg. volume | 95,649 |
| 50-day MA | $11.77 | Dividend yield | N/A |
| 200-day MA | $17.33 | Market Cap | 48.99M |
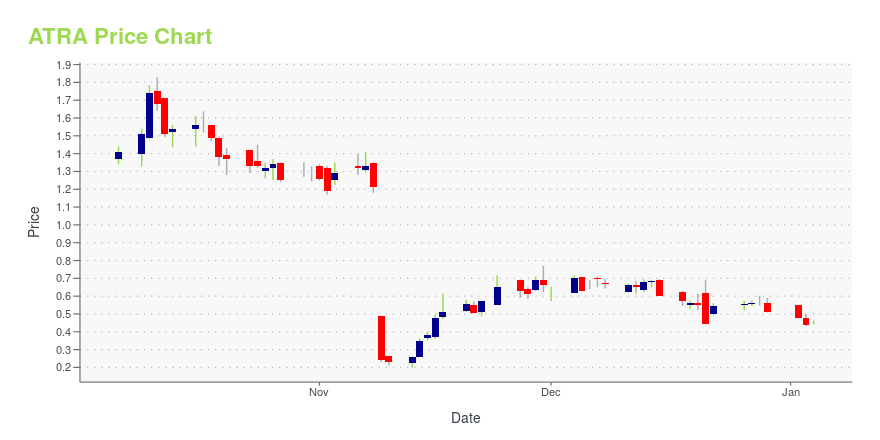
ATRA Stock Price Chart Interactive Chart >
Atara Biotherapeutics, Inc. (ATRA) Company Bio
Atara Biotherapeutics is a biopharmaceutical company focused on developing innovative therapies for patients with debilitating diseases. The company was founded in 2012 and is based in South San Francisco, California.
Latest ATRA News From Around the Web
Below are the latest news stories about ATARA BIOTHERAPEUTICS INC that investors may wish to consider to help them evaluate ATRA as an investment opportunity.
Atara Biotherapeutics Announces Closing of Expanded Global Tab-cel® Partnership with Pierre Fabre LaboratoriesTHOUSAND OAKS, Calif., December 20, 2023--Atara Biotherapeutics, Inc. (Nasdaq: ATRA), a leader in T-cell immunotherapy, leveraging its novel allogeneic Epstein-Barr virus (EBV) T-cell platform to develop transformative therapies for patients with cancer and autoimmune diseases, today announced the closing of the expanded global partnership with Pierre Fabre Laboratories for tabelecleucel (tab-cel® or EBVALLOTM). Building on the earlier partnership announced in October 2021 to commercialize tab-c |
Atara Biotherapeutics Presents Positive Preclinical Data on ATA3431, A Next-Generation Allogeneic CD20/CD19-Targeted CAR, at the 65th ASH Annual MeetingTHOUSAND OAKS, Calif., December 11, 2023--Atara Biotherapeutics, Inc. (Nasdaq: ATRA), a leader in T-cell immunotherapy, leveraging its novel allogeneic Epstein-Barr virus (EBV) T-cell platform to develop transformative therapies for patients with cancer and autoimmune diseases, today announced preclinical data on ATA3431, a next-generation allogeneic CD20/CD19-dual targeted chimeric antigen receptor (CAR) EBV T-cell therapy candidate. Findings support ATA3431 advancement into clinical testing, i |
Atara Biotherapeutics, Inc. Reports Inducement Grants Under Nasdaq Listing Rule 5635(c)(4)THOUSAND OAKS, Calif., December 01, 2023--Atara Biotherapeutics, Inc. (Nasdaq: ATRA), a leader in T-cell immunotherapy, leveraging its novel allogeneic Epstein-Barr virus (EBV) T-cell platform to develop transformative therapies for patients with cancer and autoimmune diseases, today reported the grant of 27,000 restricted stock units of Atara’s common stock to three newly hired employees. These awards were approved by the Compensation Committee of Atara’s Board of Directors and granted under th |
Atara Biotherapeutics To Present Positive New Tab-cel® Clinical Data During Oral Session at ESMO Immuno-Oncology Annual Congress 2023THOUSAND OAKS, Calif., November 29, 2023--Atara Biotherapeutics, Inc. (Nasdaq: ATRA), a leader in T-cell immunotherapy, leveraging its novel allogeneic Epstein-Barr virus (EBV) T-cell platform to develop transformative therapies for patients with cancer and autoimmune diseases, today announced positive new data for tabelecleucel (tab-cel® or EBVALLO™) in patients with relapsed or refractory (r/r) or treatment-naïve Epstein-Barr virus-positive post-transplant lymphoproliferative disease involving |
Atara Biotherapeutics (ATRA) Slumps 57% in a Month: Here's WhyAtara's (ATRA) shares fell after a phase II study evaluating its multiple sclerosis therapy did not meet its primary endpoint. |
ATRA Price Returns
| 1-mo | 39.41% |
| 3-mo | -41.04% |
| 6-mo | -32.46% |
| 1-year | -77.27% |
| 3-year | -96.77% |
| 5-year | -97.23% |
| YTD | -20.67% |
| 2023 | -84.37% |
| 2022 | -79.19% |
| 2021 | -19.71% |
| 2020 | 19.19% |
| 2019 | -52.59% |
Loading social stream, please wait...