Air Transport Services Group, Inc (ATSG): Price and Financial Metrics
ATSG Price/Volume Stats
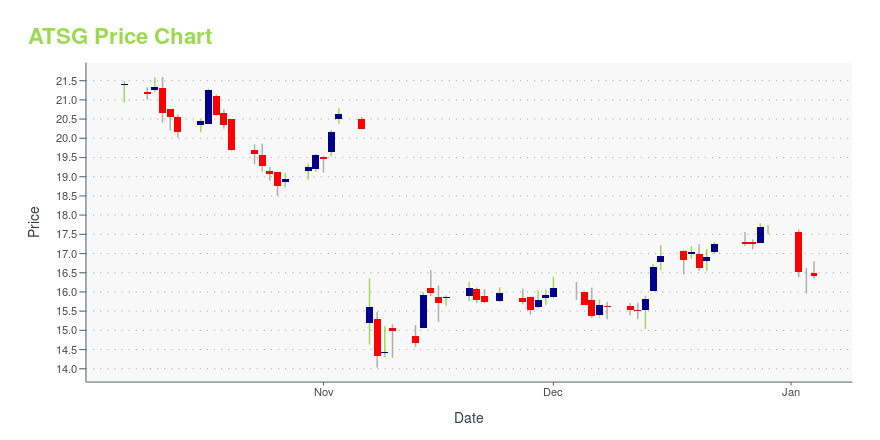
Current price | $17.36 | 52-week high | $34.00 |
Prev. close | $17.48 | 52-week low | $14.39 |
Day low | $17.20 | Volume | 659,400 |
Day high | $17.77 | Avg. volume | 545,892 |
50-day MA | $18.98 | Dividend yield | N/A |
200-day MA | $24.85 | Market Cap | 1.24B |
ATSG Stock Price Chart Interactive Chart >
ATSG POWR Grades
- ATSG scores best on the Momentum dimension, with a Momentum rank ahead of 67.64% of US stocks.
- ATSG's strongest trending metric is Stability; it's been moving down over the last 179 days.
- ATSG ranks lowest in Growth; there it ranks in the 7th percentile.
ATSG Stock Summary
- Price to trailing twelve month operating cash flow for ATSG is currently 2.2, higher than just 9.95% of US stocks with positive operating cash flow.
- ATSG's price/sales ratio is 0.6; that's higher than the P/S ratio of just 20.95% of US stocks.
- AIR TRANSPORT SERVICES GROUP INC's shareholder yield -- a measure of how much capital is returned to stockholders via dividends and buybacks -- is -15.82%, greater than the shareholder yield of only 20.58% of stocks in our set.
- Stocks that are quantitatively similar to ATSG, based on their financial statements, market capitalization, and price volatility, are AEO, TPB, DISH, EYE, and TAST.
- ATSG's SEC filings can be seen here. And to visit AIR TRANSPORT SERVICES GROUP INC's official web site, go to www.atsginc.com.
ATSG Valuation Summary
- ATSG's price/earnings ratio is 7.2; this is 60.66% lower than that of the median Industrials stock.
- Over the past 239 months, ATSG's price/sales ratio has gone up 0.5.
Below are key valuation metrics over time for ATSG.
Stock | Date | P/S | P/B | P/E | EV/EBIT |
---|---|---|---|---|---|
ATSG | 2023-05-19 | 0.6 | 0.9 | 7.2 | 9.9 |
ATSG | 2023-05-18 | 0.6 | 0.8 | 7.1 | 9.9 |
ATSG | 2023-05-17 | 0.6 | 0.8 | 6.9 | 9.8 |
ATSG | 2023-05-16 | 0.6 | 0.8 | 6.8 | 9.7 |
ATSG | 2023-05-15 | 0.6 | 0.8 | 6.8 | 9.7 |
ATSG | 2023-05-12 | 0.5 | 0.8 | 6.6 | 9.6 |
ATSG Growth Metrics
- Its year over year net income to common stockholders growth rate is now at 478.65%.
- The 5 year net income to common stockholders growth rate now stands at 596.98%.
- The 3 year price growth rate now stands at 33.51%.

The table below shows ATSG's growth in key financial areas (numbers in millions of US dollars).
Date | Revenue | Operating Cash Flow | Net Income to Common Stock |
---|---|---|---|
2022-09-30 | 1,994.811 | 552.389 | 200.454 |
2022-06-30 | 1,943.85 | 526.575 | 214.084 |
2022-03-31 | 1,844.054 | 584.778 | 238.926 |
2021-12-31 | 1,734.282 | 583.557 | 231.42 |
2021-09-30 | 1,651.273 | 518.256 | 192.023 |
2021-06-30 | 1,589.464 | 570.497 | 121.76 |
ATSG's Quality Factors
The “Quality” component of the POWR Ratings focuses on 31 different factors of a companies fundamentals and operational strength. Here are some key insights as we drill into the specifics of these quality attributes.- ATSG has a Quality Grade of C, ranking ahead of 32.64% of graded US stocks.
- ATSG's asset turnover comes in at 0.52 -- ranking 44th of 137 Transportation stocks.
- BPMP, HTLD, and TDW are the stocks whose asset turnover ratios are most correlated with ATSG.
The table below shows ATSG's key quality metrics over time.
Period | Asset Turnover | Gross Margin | ROIC |
---|---|---|---|
2021-06-30 | 0.520 | 0.749 | 0.062 |
2021-03-31 | 0.521 | 0.749 | 0.005 |
2020-12-31 | 0.531 | 0.743 | 0.030 |
2020-09-30 | 0.541 | 0.735 | 0.018 |
2020-06-30 | 0.538 | 0.732 | 0.048 |
2020-03-31 | 0.534 | 0.729 | 0.073 |
ATSG Price Target
For more insight on analysts targets of ATSG, see our ATSG price target page. And for a list of of all stocks sorted by upside potential based on analyst target price, see our Top Price Target page.
Average Price Target | $32.50 | Average Broker Recommendation | 1.33 (Strong Buy) |
Air Transport Services Group, Inc (ATSG) Company Bio
Air Transport Services Group provides aircraft leasing and air cargo transportation and related services to domestic and foreign air carriers and other companies that outsource their air cargo lift requirements. The company was founded in 1980 and is based in Wilmington, Ohio.
Latest ATSG News From Around the Web
Below are the latest news stories about AIR TRANSPORT SERVICES GROUP INC that investors may wish to consider to help them evaluate ATSG as an investment opportunity.
Chairman of the Board of Air Transport Services Group Joseph Hete Buys 1.3% More Shares \Whilst it may not be a huge deal, we thought it was good to see that the Air Transport Services Group, Inc... |
Air Transport Services (ATSG) Lags on Q1 Earnings & RevenuesAir Transport Services' (ATSG) first-quarter 2023 earnings decrease year over year while revenues increase. |
Down More Than 50%: These 2 ‘Strong Buy’ Stocks Are Trading in Oversold TerritoryEvery investor would naturally like to see the stocks that make up their portfolio show a consistent upward curve, but that, as everyone learns eventually, is just not the way it works. Peaks and troughs are part of the investing game, and even the stock market kings go through periods of serous pullbacks for one reason or another, be it macro developments or some news item that spooked investors. And every so often, despite sound fundamentals, the pendulum swings too far into negative terrain, |
Wall Street sours on ATSG freighter spend during cargo slowdownAmazon air cargo partner ATSG has its eye on long-term growth, but investors with a shorter horizon are wary of big expenditures for cargo jets as shipping demand wanes. The post Wall Street sours on ATSG freighter spend during cargo slowdown appeared first on FreightWaves. |
Air Transport Services (ATSG) Reports Q1 Earnings: What Key Metrics Have to SayAlthough the revenue and EPS for Air Transport Services (ATSG) give a sense of how its business performed in the quarter ended March 2023, it might be worth considering how some key metrics compare with Wall Street estimates and the year-ago numbers. |
ATSG Price Returns
1-mo | -14.52% |
3-mo | -17.45% |
6-mo | -38.70% |
1-year | N/A |
3-year | -19.41% |
5-year | -17.33% |
YTD | -33.18% |
2022 | -11.57% |
2021 | -6.25% |
2020 | 33.59% |
2019 | 2.85% |
2018 | -1.43% |
Continue Researching ATSG
Want to do more research on Air Transport Services Group Inc's stock and its price? Try the links below:Air Transport Services Group Inc (ATSG) Stock Price | Nasdaq
Air Transport Services Group Inc (ATSG) Stock Quote, History and News - Yahoo Finance
Air Transport Services Group Inc (ATSG) Stock Price and Basic Information | MarketWatch
Loading social stream, please wait...