
Applied UV Inc. (AUVI): Price and Financial Metrics
AUVI Price/Volume Stats
| Current price | $0.29 | 52-week high | $57.00 |
| Prev. close | $0.32 | 52-week low | $0.18 |
| Day low | $0.25 | Volume | 5,796,800 |
| Day high | $0.31 | Avg. volume | 1,142,982 |
| 50-day MA | $0.83 | Dividend yield | N/A |
| 200-day MA | $4.59 | Market Cap | 1.25M |
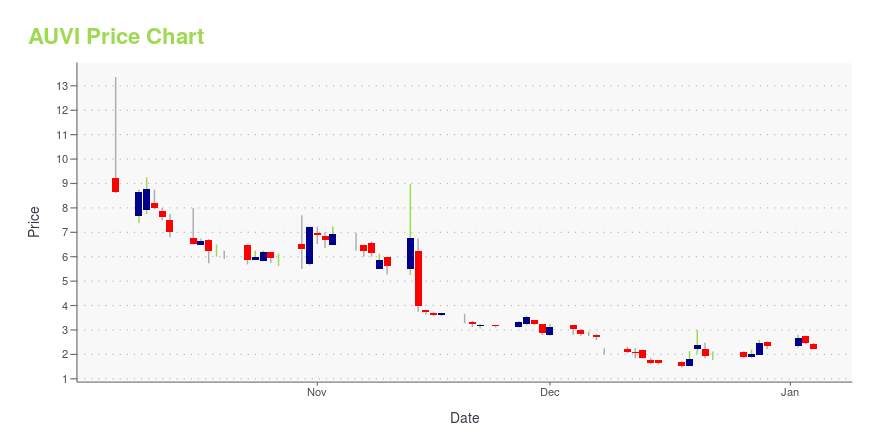
AUVI Stock Price Chart Interactive Chart >
Applied UV Inc. (AUVI) Company Bio
Applied UV, Inc. engages in the design, manufacture, development, and sale of infection prevention UV products for the healthcare, hospitality, and residential industries. It operates under the Disinfectant and Hospitality Segments. The Disinfectant segment designs, manufactures, assembles, and distributes automated disinfecting mirror systems for use in hospitals and other healthcare facilities. The Hospitality segment manufactures fine mirrors specifically for the hospitality industry. The company was founded on February 26, 2019 and is headquartered in Mount Vernon, NY.
Latest AUVI News From Around the Web
Below are the latest news stories about APPLIED UV INC that investors may wish to consider to help them evaluate AUVI as an investment opportunity.
Applied UV Announces Successful Integration of Its PURO UV Disinfection and Airocide Food Preservation Units to Optimize Cost Reduction and Expand Global Growth OpportunitiesNew organizational structure to maximize revenue opportunities and reduce costs across several operating units Cost saving initiatives are expected to reduce ongoing operating expenses in excess of $1 million annually beginning in January 2024; Management expects the Company’s operating units to be cash flow positive in the second quarter of 2024 NEW YORK, NY, Dec. 18, 2023 (GLOBE NEWSWIRE) -- via NewMediaWire -- Applied UV, Inc. (“Applied UV” or the “Company”) (Nasdaq: AUVI), a leader in global |
Today’s Biggest Pre-Market Stock Movers: 10 Top Gainers and Losers on ThursdayIt's time to start the day off right with a look at the biggest pre-market stock movers to watch for Thursday morning! |
AUVI Stock Earnings: Applied UV Beats EPS, Misses Revenue for Q2 2023AUVI stock results show that Applied UV beat analyst estimates for earnings per share but missed on revenue for the second quarter of 2023. |
AUVI Stock Earnings: Applied UV Misses EPS, Beats Revenue for Q1 2023AUVI stock results show that Applied UV missed analyst estimates for earnings per share but beat on revenue for the first quarter of 2023. |
AUVI Stock Earnings: Applied UV Reported Results for Q3 2023Applied UV just reported results for the third quarter of 2023. |
AUVI Price Returns
| 1-mo | N/A |
| 3-mo | -49.13% |
| 6-mo | -89.42% |
| 1-year | -98.59% |
| 3-year | -99.97% |
| 5-year | N/A |
| YTD | -87.71% |
| 2023 | -97.91% |
| 2022 | -66.49% |
| 2021 | -41.18% |
| 2020 | N/A |
| 2019 | N/A |
Loading social stream, please wait...