American Vanguard Corp. (AVD): Price and Financial Metrics
GET POWR RATINGS... FREE!
AVD POWR Grades
- Value is the dimension where AVD ranks best; there it ranks ahead of 92.66% of US stocks.
- The strongest trend for AVD is in Stability, which has been heading up over the past 179 days.
- AVD's current lowest rank is in the Momentum metric (where it is better than 62.7% of US stocks).
AVD Stock Summary
- American Vanguard Corp's stock had its IPO on June 22, 1988, making it an older stock than 89.23% of US equities in our set.
- Of note is the ratio of American Vanguard Corp's sales and general administrative expense to its total operating expenses; 95.89% of US stocks have a lower such ratio.
- With a year-over-year growth in debt of -34.83%, American Vanguard Corp's debt growth rate surpasses only 11.65% of about US stocks.
- Stocks with similar financial metrics, market capitalization, and price volatility to American Vanguard Corp are SMP, CLFD, LYTS, MYRG, and GNE.
- AVD's SEC filings can be seen here. And to visit American Vanguard Corp's official web site, go to www.american-vanguard.com.
AVD Valuation Summary
- In comparison to the median Basic Materials stock, AVD's price/sales ratio is 43.75% lower, now standing at 0.9.
- AVD's price/sales ratio has moved up 0.4 over the prior 243 months.
- AVD's EV/EBIT ratio has moved up 15.5 over the prior 243 months.
Below are key valuation metrics over time for AVD.
Stock | Date | P/S | P/B | P/E | EV/EBIT |
---|---|---|---|---|---|
AVD | 2021-09-03 | 0.9 | 1.3 | 25.3 | 21.9 |
AVD | 2021-09-02 | 1.0 | 1.3 | 25.8 | 22.2 |
AVD | 2021-09-01 | 0.9 | 1.3 | 25.0 | 21.7 |
AVD | 2021-08-31 | 0.9 | 1.3 | 24.9 | 21.6 |
AVD | 2021-08-30 | 0.9 | 1.3 | 24.8 | 21.6 |
AVD | 2021-08-27 | 0.9 | 1.3 | 24.5 | 21.4 |
AVD Growth Metrics
- Its 2 year revenue growth rate is now at 19.56%.
- The 3 year cash and equivalents growth rate now stands at -15.9%.
- Its year over year net income to common stockholders growth rate is now at 74.19%.

The table below shows AVD's growth in key financial areas (numbers in millions of US dollars).
Date | Revenue | Operating Cash Flow | Net Income to Common Stock |
---|---|---|---|
2021-12-31 | 556.872 | 86.361 | 18.587 |
2021-09-30 | 538.811 | 69.827 | 21.621 |
2021-06-30 | 508.952 | 64.606 | 19.05 |
2021-03-31 | 478.897 | 70.544 | 17.793 |
2020-12-31 | 458.704 | 89.198 | 15.242 |
2020-09-30 | 448.478 | 50.284 | 10.77 |
AVD's Quality Factors
The “Quality” component of the POWR Ratings focuses on 31 different factors of a companies fundamentals and operational strength. Here are some key insights as we drill into the specifics of these quality attributes.- AVD has a Quality Grade of C, ranking ahead of 59.91% of graded US stocks.
- AVD's asset turnover comes in at 0.727 -- ranking 34th of 89 Chemicals stocks.
- CC, ICL, and ASIX are the stocks whose asset turnover ratios are most correlated with AVD.
The table below shows AVD's key quality metrics over time.
Period | Asset Turnover | Gross Margin | ROIC |
---|---|---|---|
2021-06-30 | 0.727 | 0.376 | 0.067 |
2021-03-31 | 0.702 | 0.374 | 0.064 |
2020-12-31 | 0.682 | 0.376 | 0.054 |
2020-09-30 | 0.669 | 0.376 | 0.042 |
2020-06-30 | 0.679 | 0.379 | 0.047 |
2020-03-31 | 0.690 | 0.375 | 0.045 |
AVD Price Target
For more insight on analysts targets of AVD, see our AVD price target page. And for a list of of all stocks sorted by upside potential based on analyst target price, see our Top Price Target page.
Average Price Target | $23.50 | Average Broker Recommendation | 1.5 (Moderate Buy) |
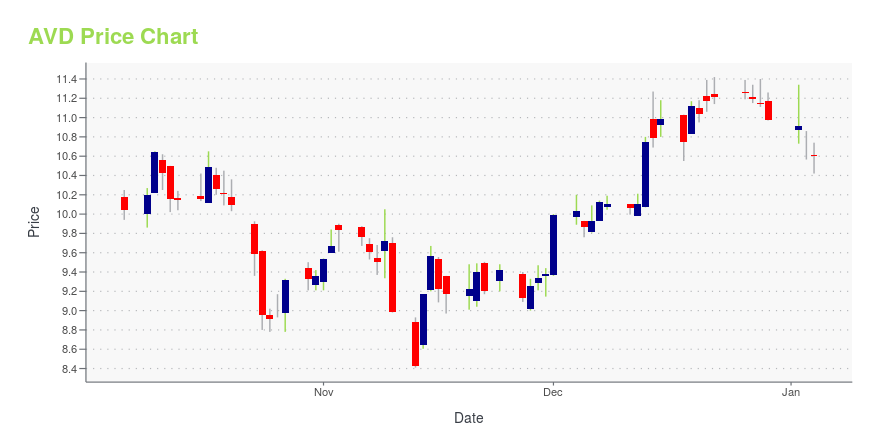
AVD Stock Price Chart Interactive Chart >
AVD Price/Volume Stats
Current price | $23.01 | 52-week high | $24.25 |
Prev. close | $23.07 | 52-week low | $13.82 |
Day low | $22.46 | Volume | 418,000 |
Day high | $23.20 | Avg. volume | 228,630 |
50-day MA | $21.17 | Dividend yield | 0.43% |
200-day MA | $16.93 | Market Cap | 709.01M |
American Vanguard Corp. (AVD) Company Bio
American Vanguard Corporation develops, manufactures, and markets specialty chemicals for agricultural, commercial, and consumer uses in the United States and internationally. The company was founded in 1969 and is based in Newport Beach, California.
Latest AVD News From Around the Web
Below are the latest news stories about American Vanguard Corp that investors may wish to consider to help them evaluate AVD as an investment opportunity.
Shareholders in American Vanguard (NYSE:AVD) are in the red if they invested a year agoIt's easy to match the overall market return by buying an index fund. When you buy individual stocks, you can make... |
American Vanguard (NYSE:AVD) Stock Crosses Above 200-Day Moving Average of $0.00American Vanguard Co. (NYSE:AVD) shares crossed above its 200-day moving average during trading on Tuesday . The stock has a 200-day moving average of $0.00 and traded as high as $15.23. American Vanguard shares last traded at $15.22, with a volume of 195,095 shares trading hands. Separately, Roth Capital reissued a buy rating on shares [] The post American Vanguard (NYSE:AVD) Stock Crosses Above 200-Day Moving Average of $0.00 appeared first on ETF Daily News . |
Is American Vanguard Corporation's (NYSE:AVD) Stock Price Struggling As A Result Of Its Mixed Financials?It is hard to get excited after looking at American Vanguard's (NYSE:AVD) recent performance, when its stock has... |
American Vanguard Declares Quarterly DividendNEWPORT BEACH, Calif.--(BUSINESS WIRE)--American Vanguard Corporation (NYSE:AVD) announced that its Board of Directors has declared a $0.02 cash dividend payment to be distributed on January 10, 2022, to shareholders of record as of December 27, 2021. Eric Wintemute, Chairman and CEO of American Vanguard, stated, This dividend payment continues our history of providing cash returns to shareholders based on successful operational and financial performance. It reflects the confidence that the Bo |
American Vanguard Corporation Consensus Indicates Potential 32.5% UpsideAmerican Vanguard Corporation found using ticker (AVD) have now 2 analysts covering the stock with the consensus suggesting a rating of ''Buy''. The range between the high target price and low target price is between 24 and 23 with a mean TP of 23.5. Given that the stocks previous close was at 17.74 this would indicate that there is a potential upside of 32.5%. There is a 50 day moving average of 15.84 and the 200 day MA is 16.67. The market capitalisation for the company is $537m. Company Website: /> [stock_market_widget type="chart" symbol="AVD" chart="bar" range="6mo" interval="1d" line-color="rgb(49, 125, 189)"] American Vanguard Corporation, through its subsidiaries, develops, manufactures, and markets specialty chemicals for agricultural, commercial, and consumer uses in the Unite... |
AVD Price Returns
1-mo | 6.23% |
3-mo | 62.13% |
6-mo | 52.57% |
1-year | 27.28% |
3-year | 69.97% |
5-year | 36.54% |
YTD | 40.57% |
2021 | 6.11% |
2020 | -20.06% |
2019 | 28.80% |
2018 | -22.36% |
2017 | 2.94% |
AVD Dividends
Ex-Dividend Date | Type | Payout Amount | Change | ||||||
---|---|---|---|---|---|---|---|---|---|
Loading, please wait... |
Continue Researching AVD
Want to do more research on American Vanguard Corp's stock and its price? Try the links below:American Vanguard Corp (AVD) Stock Price | Nasdaq
American Vanguard Corp (AVD) Stock Quote, History and News - Yahoo Finance
American Vanguard Corp (AVD) Stock Price and Basic Information | MarketWatch
Loading social stream, please wait...