
Avinger, Inc. (AVGR): Price and Financial Metrics
AVGR Price/Volume Stats
| Current price | $1.42 | 52-week high | $14.00 |
| Prev. close | $1.61 | 52-week low | $1.22 |
| Day low | $1.22 | Volume | 974,900 |
| Day high | $1.50 | Avg. volume | 40,471 |
| 50-day MA | $2.05 | Dividend yield | N/A |
| 200-day MA | $3.06 | Market Cap | 2.42M |
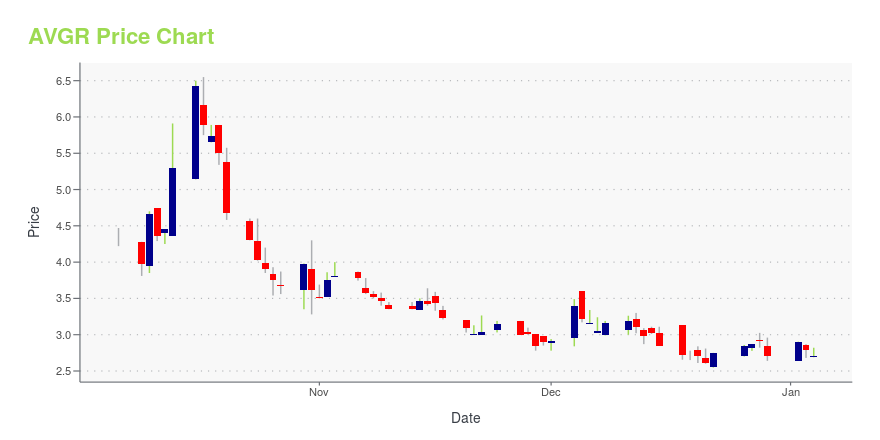
AVGR Stock Price Chart Interactive Chart >
Avinger, Inc. (AVGR) Company Bio
Avinger, Inc. designs, manufactures, and sells image-guided and catheter-based systems used by physicians to treat patients with peripheral arterial disease in the United States and Europe. The company was founded in 2007 and is based in Redwood City, California.
Latest AVGR News From Around the Web
Below are the latest news stories about AVINGER INC that investors may wish to consider to help them evaluate AVGR as an investment opportunity.
Avinger, Inc. (NASDAQ:AVGR) Q3 2023 Earnings Call TranscriptAvinger, Inc. (NASDAQ:AVGR) Q3 2023 Earnings Call Transcript October 26, 2023 Avinger, Inc. misses on earnings expectations. Reported EPS is $-2.92 EPS, expectations were $-2.85. Operator: Greetings. Welcome to the Avinger Third Quarter 2023 Results Conference Call. At this time, all participants are in a listen-only mode. A question-and-answer session will follow the formal presentation. […] |
Avinger (AVGR) Reports Q3 Loss, Lags Revenue EstimatesAvinger (AVGR) delivered earnings and revenue surprises of -2.46% and 24.29%, respectively, for the quarter ended September 2023. Do the numbers hold clues to what lies ahead for the stock? |
Avinger Reports Third Quarter 2023 ResultsREDWOOD CITY, CA / ACCESSWIRE / October 26, 2023 / Avinger, Inc. (NASDAQ:AVGR), a commercial-stage medical device company developing and marketing the first and only intravascular image-guided, catheter-based systems for diagnosis and treatment of ... |
Avinger to Announce Third Quarter 2023 Results on October 26REDWOOD CITY, CA / ACCESSWIRE / October 19, 2023 / Avinger, Inc. (NASDAQ:AVGR), a commercial-stage medical device company marketing the first and only intravascular image-guided, catheter-based system for diagnosis and treatment of vascular disease, ... |
Avinger Raises $5.3 Million via At-The-Market FacilityStrengthens Balance Sheet in Support of Tigereye ST Launch and Coronary Product DevelopmentREDWOOD CITY, CA / ACCESSWIRE / September 27, 2023 / Avinger, Inc. (NASDAQ:AVGR), a commercial-stage medical device company marketing the first and only intravascular ... |
AVGR Price Returns
| 1-mo | -26.80% |
| 3-mo | -61.93% |
| 6-mo | -50.52% |
| 1-year | -88.86% |
| 3-year | -99.50% |
| 5-year | -99.80% |
| YTD | -47.60% |
| 2023 | -83.35% |
| 2022 | -87.94% |
| 2021 | 2.25% |
| 2020 | -61.39% |
| 2019 | -62.00% |
Continue Researching AVGR
Want to do more research on Avinger Inc's stock and its price? Try the links below:Avinger Inc (AVGR) Stock Price | Nasdaq
Avinger Inc (AVGR) Stock Quote, History and News - Yahoo Finance
Avinger Inc (AVGR) Stock Price and Basic Information | MarketWatch
Loading social stream, please wait...