Avery Dennison Corp. (AVY): Price and Financial Metrics
GET POWR RATINGS... FREE!
AVY POWR Grades
- Quality is the dimension where AVY ranks best; there it ranks ahead of 89.73% of US stocks.
- The strongest trend for AVY is in Sentiment, which has been heading down over the past 177 days.
- AVY ranks lowest in Value; there it ranks in the 18th percentile.
AVY Stock Summary
- AVERY DENNISON CORP's capital turnover -- a measure of revenue relative to shareholder's equity -- is better than 89.77% of US listed stocks.
- AVY's one year PEG ratio, measuring expected growth in earnings next year relative to current common stock price is 221.22 -- higher than 88.35% of US-listed equities with positive expected earnings growth.
- AVY's went public 37.12 years ago, making it older than 93.49% of listed US stocks we're tracking.
- Stocks that are quantitatively similar to AVY, based on their financial statements, market capitalization, and price volatility, are HUBB, LECO, K, TTC, and MAT.
- Visit AVY's SEC page to see the company's official filings. To visit the company's web site, go to www.averydennison.com.
AVY Valuation Summary
- In comparison to the median Industrials stock, AVY's price/sales ratio is 30.77% higher, now standing at 1.7.
- Over the past 243 months, AVY's price/sales ratio has gone up 0.1.
Below are key valuation metrics over time for AVY.
Stock | Date | P/S | P/B | P/E | EV/EBIT |
---|---|---|---|---|---|
AVY | 2023-01-24 | 1.7 | 7.7 | 18.8 | 15.9 |
AVY | 2023-01-23 | 1.7 | 7.7 | 19.0 | 16.1 |
AVY | 2023-01-20 | 1.7 | 7.7 | 18.9 | 16.0 |
AVY | 2023-01-19 | 1.6 | 7.5 | 18.4 | 15.6 |
AVY | 2023-01-18 | 1.7 | 7.6 | 18.8 | 15.9 |
AVY | 2023-01-17 | 1.7 | 7.8 | 19.2 | 16.2 |
AVY Growth Metrics
- Its 2 year price growth rate is now at 67.64%.
- The 4 year price growth rate now stands at 29.5%.
- Its 2 year revenue growth rate is now at 23.44%.

The table below shows AVY's growth in key financial areas (numbers in millions of US dollars).
Date | Revenue | Operating Cash Flow | Net Income to Common Stock |
---|---|---|---|
2022-09-30 | 9,196.6 | 899.2 | 816.9 |
2022-06-30 | 8,951.3 | 964.4 | 759.5 |
2022-03-31 | 8,706.3 | 963.7 | 728.8 |
2021-12-31 | 8,408.3 | 1,046.8 | 740.1 |
2021-09-30 | 8,216 | 1,072.3 | 748.9 |
2021-06-30 | 7,873.3 | 1,044.1 | 735.3 |
AVY's Quality Factors
The “Quality” component of the POWR Ratings focuses on 31 different factors of a companies fundamentals and operational strength. Here are some key insights as we drill into the specifics of these quality attributes.- AVY has a Quality Grade of B, ranking ahead of 86.43% of graded US stocks.
- AVY's asset turnover comes in at 1.229 -- ranking 2nd of 21 Business Supplies stocks.
- NP, HNI, and VIRC are the stocks whose asset turnover ratios are most correlated with AVY.
The table below shows AVY's key quality metrics over time.
Period | Asset Turnover | Gross Margin | ROIC |
---|---|---|---|
2021-10-02 | 1.229 | 0.280 | 0.218 |
2021-07-03 | 1.285 | 0.283 | 0.224 |
2021-04-03 | 1.230 | 0.279 | 0.194 |
2021-01-02 | 1.176 | 0.276 | 0.176 |
2020-09-26 | 1.168 | 0.272 | 0.164 |
2020-06-27 | 1.194 | 0.269 | 0.168 |
AVY Price Target
For more insight on analysts targets of AVY, see our AVY price target page. And for a list of of all stocks sorted by upside potential based on analyst target price, see our Top Price Target page.
Average Price Target | $233.00 | Average Broker Recommendation | 1.54 (Moderate Buy) |
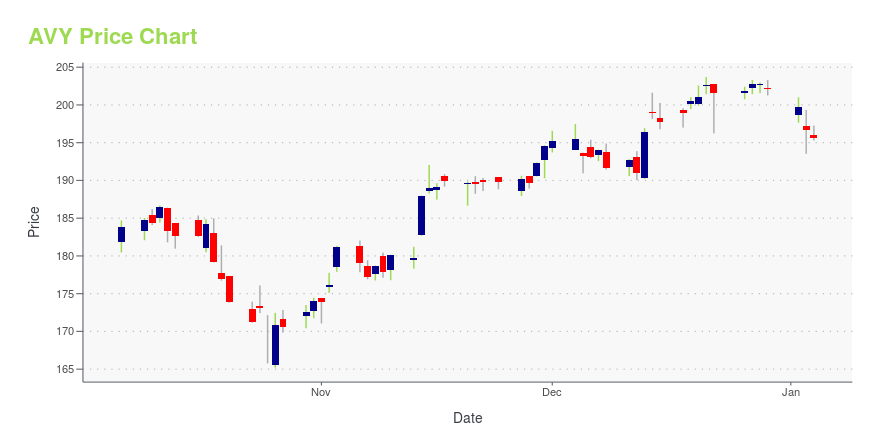
AVY Stock Price Chart Interactive Chart >
AVY Price/Volume Stats
Current price | $181.20 | 52-week high | $204.37 |
Prev. close | $188.56 | 52-week low | $151.62 |
Day low | $180.61 | Volume | 595,200 |
Day high | $187.78 | Avg. volume | 491,648 |
50-day MA | $186.60 | Dividend yield | 1.66% |
200-day MA | $178.49 | Market Cap | 14.67B |
Avery Dennison Corp. (AVY) Company Bio
Avery Dennison Corporation is a multinational manufacturer and distributor of pressure-sensitive adhesive materials (such as self-adhesive labels), apparel branding labels and tags, RFID inlays, and specialty medical products. The company is a member of the Fortune 500 and is headquartered in Glendale, California. (Source:Wikipedia)
Latest AVY News From Around the Web
Below are the latest news stories about AVERY DENNISON CORP that investors may wish to consider to help them evaluate AVY as an investment opportunity.
Avery Dennison Corp. (AVY) Q4 2022 Earnings Call TranscriptAvery Dennison Corp. (AVY) Q4 2022 Earnings Conference Call Feb 02, 2023, 01:00 PM ET Company Participants John Eble - Head of Investor Relations Mitch Butier - Chairman and CEO Greg Lovins - Senior Vice President and CFO Deon Stander - President and COO Conference Call Participants Ghansham Panjabi - Robert W. Baird Adam Josephson - KeyBanc Capital Markets George Staphos - BofA Securities John McNulty - BMO Capital Markets Bryan Burgmeier - Citigroup Mike Roxland - Truist Securities Jeffrey Zekauskas - JPMorgan Securities Josh Spector - UBS Securities Presentation Operator Ladies and gentlemen, thank you... |
Avery Dennison (AVY) Q4 Earnings Miss Estimates on Low VolumesAvery Dennison (AVY) reports year-over-year decline in Q4 earnings and revenues owing to lower volumes as customers continue to adjust inventory levels. |
Avery Dennison (AVY) Lags Q4 Earnings and Revenue EstimatesAvery Dennison (AVY) delivered earnings and revenue surprises of -21.43% and 8.13%, respectively, for the quarter ended December 2022. Do the numbers hold clues to what lies ahead for the stock? |
Avery Dennison Declares Quarterly DividendMENTOR, Ohio, February 02, 2023--The Board of Directors of Avery Dennison Corporation (NYSE:AVY) has declared a quarterly cash dividend of $0.75 per share. The dividend is payable on March 15, 2023, to shareholders of record on March 1, 2023. |
Avery Dennison Announces Fourth Quarter and Full Year 2022 ResultsMENTOR, Ohio, February 02, 2023--Avery Dennison Corporation (NYSE:AVY) today announced preliminary, unaudited results for its fourth quarter and full year ended December 31, 2022. Non-GAAP financial measures referenced in this release are reconciled from GAAP in the attached financial schedules. Unless otherwise indicated, comparisons are to the same period in the prior year. |
AVY Price Returns
1-mo | -3.78% |
3-mo | 3.28% |
6-mo | -5.69% |
1-year | -2.72% |
3-year | 36.89% |
5-year | 73.05% |
YTD | 0.11% |
2022 | -15.06% |
2021 | 41.41% |
2020 | 20.86% |
2019 | 48.54% |
2018 | -20.28% |
AVY Dividends
Ex-Dividend Date | Type | Payout Amount | Change | ||||||
---|---|---|---|---|---|---|---|---|---|
Loading, please wait... |
Continue Researching AVY
Here are a few links from around the web to help you further your research on Avery Dennison Corp's stock as an investment opportunity:Avery Dennison Corp (AVY) Stock Price | Nasdaq
Avery Dennison Corp (AVY) Stock Quote, History and News - Yahoo Finance
Avery Dennison Corp (AVY) Stock Price and Basic Information | MarketWatch
Loading social stream, please wait...