
Accelerate Diagnostics, Inc. (AXDX): Price and Financial Metrics
AXDX Price/Volume Stats
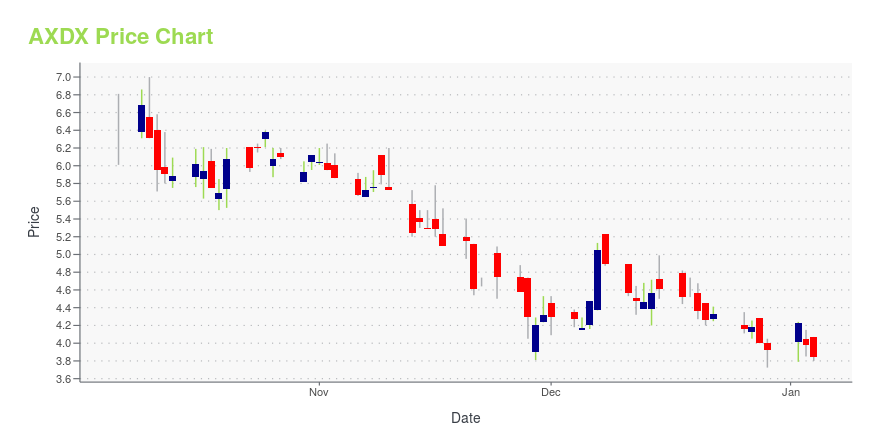
| Current price | $1.30 | 52-week high | $7.58 |
| Prev. close | $1.23 | 52-week low | $0.73 |
| Day low | $1.22 | Volume | 45,393 |
| Day high | $1.30 | Avg. volume | 93,339 |
| 50-day MA | $1.19 | Dividend yield | N/A |
| 200-day MA | $2.39 | Market Cap | 28.67M |
AXDX Stock Price Chart Interactive Chart >
Accelerate Diagnostics, Inc. (AXDX) Company Bio
Accelerate Diagnostics is an in vitro diagnostics company focused on developing and commercializing innovative systems for the rapid identification and antimicrobial susceptibility testing of infectious pathogens. The company was founded in 1982 and is based in Tucson, Arizona.
Latest AXDX News From Around the Web
Below are the latest news stories about ACCELERATE DIAGNOSTICS INC that investors may wish to consider to help them evaluate AXDX as an investment opportunity.
Accelerate Diagnostics (AXDX) Expands in In Vitro DiagnosticsAccelerate Diagnostics' (AXDX) Arc system eliminates the need for overnight culture incubation, drastically reducing the wait time for identification results. |
Bruker's (BRKR) New Collaboration to Use MALDI Biotyper SystemBruker (BRKR) and Accelerate Diagnostics are set to work together to bring rapid, automated microbial identification directly from positive blood culture samples. |
Accelerate Diagnostics Announces Collaboration for the Use of the Arc™ System in Combination With Bruker´s MALDI Biotyper®Accelerate Diagnostics, Inc. (NASDAQ: AXDX) an innovator of rapid in vitro diagnostics in microbiology, announced the signing of a collaboration and quality agreement with Bruker Corporation (NASDAQ: BRKR), the provider of the market-leading MALDI Biotyper system for microbial identification. This agreement enables both companies to validate the use of Accelerate Diagnostics' Arc™ system, an innovative, automated positive blood culture sample preparation platform, with Bruker's MALDI Biotyper® s |
Accelerate Diagnostics (AXDX) Loses -25.65% in 4 Weeks, Here's Why a Trend Reversal May be Around the CornerAccelerate Diagnostics (AXDX) is technically in oversold territory now, so the heavy selling pressure might have exhausted. This along with strong agreement among Wall Street analysts in raising earnings estimates could lead to a trend reversal for the stock. |
Accelerate Diagnostics, Inc. (NASDAQ:AXDX) Q3 2023 Earnings Call TranscriptAccelerate Diagnostics, Inc. (NASDAQ:AXDX) Q3 2023 Earnings Call Transcript November 9, 2023 Accelerate Diagnostics, Inc. beats earnings expectations. Reported EPS is $0.14, expectations were $-0.94. Operator: Good day, and welcome to the Accelerate Diagnostics, Inc. 2023 Third Quarter Results Conference Call. All participant’s will be in listen-only mode. After today’s presentation, there will be a […] |
AXDX Price Returns
| 1-mo | 11.11% |
| 3-mo | 39.77% |
| 6-mo | 1.56% |
| 1-year | -78.30% |
| 3-year | -98.10% |
| 5-year | -99.33% |
| YTD | -66.84% |
| 2023 | -44.48% |
| 2022 | -86.48% |
| 2021 | -31.13% |
| 2020 | -55.15% |
| 2019 | 46.96% |
Continue Researching AXDX
Want to see what other sources are saying about Accelerate Diagnostics Inc's financials and stock price? Try the links below:Accelerate Diagnostics Inc (AXDX) Stock Price | Nasdaq
Accelerate Diagnostics Inc (AXDX) Stock Quote, History and News - Yahoo Finance
Accelerate Diagnostics Inc (AXDX) Stock Price and Basic Information | MarketWatch
Loading social stream, please wait...