Axon Enterprise Inc. (AXON): Price and Financial Metrics
AXON Price/Volume Stats
Current price | $315.64 | 52-week high | $325.63 |
Prev. close | $319.14 | 52-week low | $175.37 |
Day low | $314.17 | Volume | 401,500 |
Day high | $321.77 | Avg. volume | 482,377 |
50-day MA | $283.05 | Dividend yield | N/A |
200-day MA | $229.91 | Market Cap | 23.82B |
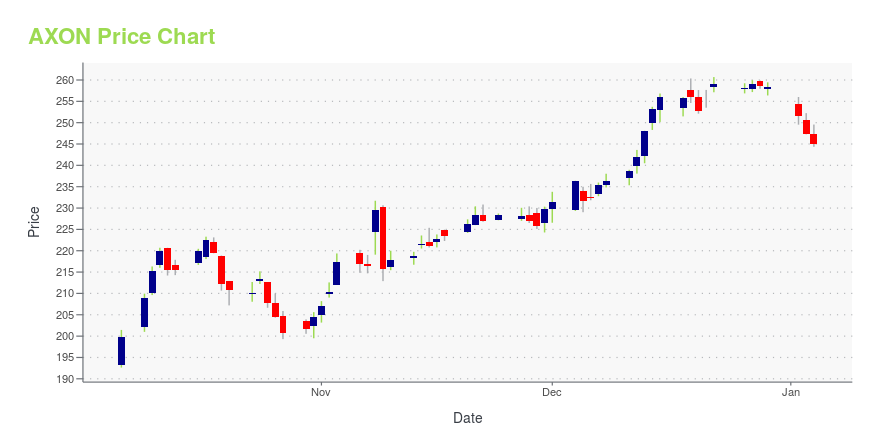
AXON Stock Price Chart Interactive Chart >
AXON POWR Grades
- Growth is the dimension where AXON ranks best; there it ranks ahead of 87.11% of US stocks.
- AXON's strongest trending metric is Stability; it's been moving up over the last 26 weeks.
- AXON's current lowest rank is in the Value metric (where it is better than 8.17% of US stocks).
AXON Stock Summary
- With a one year PEG ratio of 1,689.73, AXON ENTERPRISE INC is expected to have a higher PEG ratio (a measure of how expensive a stock is relative to its expected earnings growth) than 98.01% of US stocks.
- Price to trailing twelve month operating cash flow for AXON is currently 102.81, higher than 97.25% of US stocks with positive operating cash flow.
- With a year-over-year growth in debt of 4,262.97%, AXON ENTERPRISE INC's debt growth rate surpasses 99.73% of about US stocks.
- Stocks with similar financial metrics, market capitalization, and price volatility to AXON ENTERPRISE INC are NGS, COLB, VRCA, EGY, and HCKT.
- AXON's SEC filings can be seen here. And to visit AXON ENTERPRISE INC's official web site, go to www.axon.com.
AXON Valuation Summary
- In comparison to the median Industrials stock, AXON's EV/EBIT ratio is 743.68% higher, now standing at 146.8.
- Over the past 243 months, AXON's price/sales ratio has gone down 3.3.
Below are key valuation metrics over time for AXON.
Stock | Date | P/S | P/B | P/E | EV/EBIT |
---|---|---|---|---|---|
AXON | 2023-12-29 | 13.2 | 12.7 | 132.5 | 146.8 |
AXON | 2023-12-28 | 13.2 | 12.7 | 132.6 | 147.0 |
AXON | 2023-12-27 | 13.2 | 12.8 | 132.9 | 147.2 |
AXON | 2023-12-26 | 13.2 | 12.7 | 132.4 | 146.7 |
AXON | 2023-12-22 | 13.2 | 12.8 | 132.8 | 147.2 |
AXON | 2023-12-21 | 13.1 | 12.7 | 131.7 | 146.0 |
AXON Growth Metrics
- Its 2 year net cashflow from operations growth rate is now at 15.54%.
- Its 4 year net cashflow from operations growth rate is now at 2103.6%.
- The 4 year net income to common stockholders growth rate now stands at -107.95%.
The table below shows AXON's growth in key financial areas (numbers in millions of US dollars).
Date | Revenue | Operating Cash Flow | Net Income to Common Stock |
---|---|---|---|
2022-09-30 | 1,071.371 | 117.171 | 104.456 |
2022-06-30 | 991.606 | 92.719 | 140.849 |
2022-03-31 | 924.788 | 107.519 | 42.77 |
2021-12-31 | 863.381 | 124.494 | -60.018 |
2021-09-30 | 871.943 | 145.882 | -20.676 |
2021-06-30 | 806.396 | 140.573 | -70.073 |
AXON's Quality Factors
The “Quality” component of the POWR Ratings focuses on 31 different factors of a companies fundamentals and operational strength. Here are some key insights as we drill into the specifics of these quality attributes.- AXON has a Quality Grade of B, ranking ahead of 84.9% of graded US stocks.
- AXON's asset turnover comes in at 0.577 -- ranking 8th of 12 Defense stocks.
- LMT, KTOS, and VSTO are the stocks whose asset turnover ratios are most correlated with AXON.
The table below shows AXON's key quality metrics over time.
Period | Asset Turnover | Gross Margin | ROIC |
---|---|---|---|
2021-06-30 | 0.577 | 0.621 | -0.104 |
2021-03-31 | 0.550 | 0.619 | -0.067 |
2020-12-31 | 0.571 | 0.611 | -0.009 |
2020-09-30 | 0.592 | 0.587 | -0.046 |
2020-06-30 | 0.631 | 0.591 | -0.032 |
2020-03-31 | 0.689 | 0.582 | -0.007 |
AXON Price Target
For more insight on analysts targets of AXON, see our AXON price target page. And for a list of of all stocks sorted by upside potential based on analyst target price, see our Top Price Target page.
Average Price Target | $213.00 | Average Broker Recommendation | 1.41 (Moderate Buy) |
Axon Enterprise Inc. (AXON) Company Bio
Axovant Sciences is a clinical-stage biopharmaceutical company focused on the acquisition, development and commercialization of novel therapeutics for the treatment of dementia, a condition characterized by significant decline in mental capacity and impaired daily function. The company was founded in 2014 and is based in Hamilton, Bermuda.
Latest AXON News From Around the Web
Below are the latest news stories about AXON ENTERPRISE INC that investors may wish to consider to help them evaluate AXON as an investment opportunity.
5 Industrial Stocks Rising More Than 40% YTD With Room to RunA healthy demand environment with an improvement in supply chain and easing inflationary pressure augur well for the industrial sector heading into 2024. ETN, AXON, AOS, ALG and KAI are likely to continue their momentum. |
RETAIL SAFETY DURING THE HOLIDAYS AND BEYONDRETAIL SAFETY DURING THE HOLIDAYS AND BEYOND |
Earnings Growth & Price Strength Make Axon Enterprise (AXON) a Stock to WatchThe Zacks Focus List offers investors a way to easily find top-rated stocks and build a winning investment portfolio. Here's why you should take advantage. |
Insider Sell: Axon Enterprise Inc's President Joshua Isner Sells 4,518 SharesAxon Enterprise Inc (NASDAQ:AXON), a company specializing in the development, manufacture, and sale of conducted electrical weapons, body-worn cameras, and software, has reported an insider sell according to a recent SEC filing. |
The Schrödinger’s Cat of Presidential CandidatesToday, I have a special guest column from Charles Sizemore, Chief Investment Analyst at InvestorPlace's publishing partner, The Freeport Society. |
AXON Price Returns
1-mo | 16.12% |
3-mo | 22.18% |
6-mo | 58.62% |
1-year | 45.57% |
3-year | 134.99% |
5-year | N/A |
YTD | 22.18% |
2023 | 55.69% |
2022 | 5.69% |
2021 | 28.13% |
2020 | N/A |
2019 | N/A |
Loading social stream, please wait...