Axon Enterprise Inc. (AXON): Price and Financial Metrics
AXON Price/Volume Stats
Current price | $198.99 | 52-week high | $229.95 |
Prev. close | $196.08 | 52-week low | $112.54 |
Day low | $197.58 | Volume | 634,300 |
Day high | $201.54 | Avg. volume | 853,313 |
50-day MA | $197.82 | Dividend yield | N/A |
200-day MA | $198.80 | Market Cap | 14.88B |
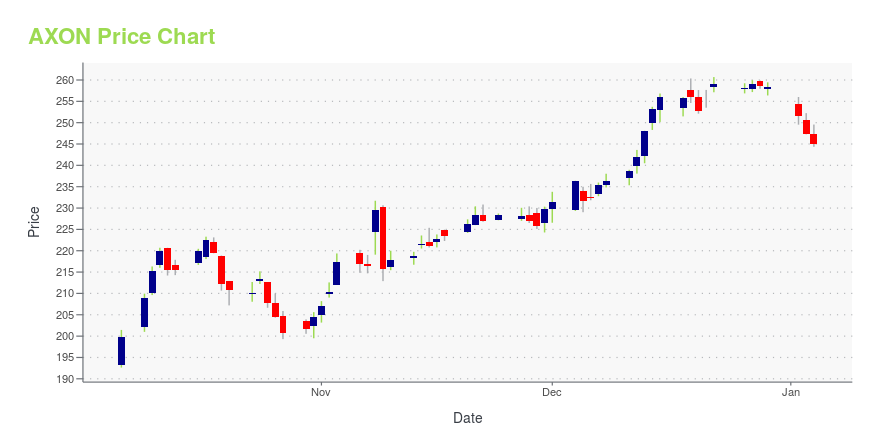
AXON Stock Price Chart Interactive Chart >
AXON POWR Grades
- AXON scores best on the Growth dimension, with a Growth rank ahead of 92.89% of US stocks.
- The strongest trend for AXON is in Momentum, which has been heading up over the past 177 days.
- AXON's current lowest rank is in the Value metric (where it is better than 6.84% of US stocks).
AXON Stock Summary
- With a price/earnings ratio of 147.77, AXON ENTERPRISE INC P/E ratio is greater than that of about 96.52% of stocks in our set with positive earnings.
- The price/operating cash flow metric for AXON ENTERPRISE INC is higher than 97.29% of stocks in our set with a positive cash flow.
- With a year-over-year growth in debt of 3,796.24%, AXON ENTERPRISE INC's debt growth rate surpasses 99.55% of about US stocks.
- If you're looking for stocks that are quantitatively similar to AXON ENTERPRISE INC, a group of peers worth examining would be VLCN, ATAI, FTFT, NXGN, and AGFY.
- Visit AXON's SEC page to see the company's official filings. To visit the company's web site, go to www.axon.com.
AXON Valuation Summary
- In comparison to the median Industrials stock, AXON's price/earnings ratio is 728.49% higher, now standing at 154.1.
- Over the past 243 months, AXON's price/earnings ratio has gone up 6.1.
Below are key valuation metrics over time for AXON.
Stock | Date | P/S | P/B | P/E | EV/EBIT |
---|---|---|---|---|---|
AXON | 2023-09-19 | 11.2 | 10.5 | 154.1 | 181.2 |
AXON | 2023-09-18 | 11.4 | 10.8 | 157.4 | 185.1 |
AXON | 2023-09-15 | 11.3 | 10.7 | 155.9 | 183.4 |
AXON | 2023-09-14 | 11.6 | 11.0 | 160.7 | 188.9 |
AXON | 2023-09-13 | 11.5 | 10.9 | 158.7 | 186.5 |
AXON | 2023-09-12 | 11.6 | 11.0 | 160.3 | 188.4 |
AXON Growth Metrics
- Its 2 year net cashflow from operations growth rate is now at 15.54%.
- Its 4 year net cashflow from operations growth rate is now at 2103.6%.
- The 4 year net income to common stockholders growth rate now stands at -107.95%.

The table below shows AXON's growth in key financial areas (numbers in millions of US dollars).
Date | Revenue | Operating Cash Flow | Net Income to Common Stock |
---|---|---|---|
2022-09-30 | 1,071.371 | 117.171 | 104.456 |
2022-06-30 | 991.606 | 92.719 | 140.849 |
2022-03-31 | 924.788 | 107.519 | 42.77 |
2021-12-31 | 863.381 | 124.494 | -60.018 |
2021-09-30 | 871.943 | 145.882 | -20.676 |
2021-06-30 | 806.396 | 140.573 | -70.073 |
AXON's Quality Factors
The “Quality” component of the POWR Ratings focuses on 31 different factors of a companies fundamentals and operational strength. Here are some key insights as we drill into the specifics of these quality attributes.- AXON has a Quality Grade of B, ranking ahead of 84.9% of graded US stocks.
- AXON's asset turnover comes in at 0.577 -- ranking 8th of 12 Defense stocks.
- LMT, KTOS, and VSTO are the stocks whose asset turnover ratios are most correlated with AXON.
The table below shows AXON's key quality metrics over time.
Period | Asset Turnover | Gross Margin | ROIC |
---|---|---|---|
2021-06-30 | 0.577 | 0.621 | -0.104 |
2021-03-31 | 0.550 | 0.619 | -0.067 |
2020-12-31 | 0.571 | 0.611 | -0.009 |
2020-09-30 | 0.592 | 0.587 | -0.046 |
2020-06-30 | 0.631 | 0.591 | -0.032 |
2020-03-31 | 0.689 | 0.582 | -0.007 |
AXON Price Target
For more insight on analysts targets of AXON, see our AXON price target page. And for a list of of all stocks sorted by upside potential based on analyst target price, see our Top Price Target page.
Average Price Target | $213.00 | Average Broker Recommendation | 1.41 (Moderate Buy) |
Axon Enterprise Inc. (AXON) Company Bio
Axovant Sciences is a clinical-stage biopharmaceutical company focused on the acquisition, development and commercialization of novel therapeutics for the treatment of dementia, a condition characterized by significant decline in mental capacity and impaired daily function. The company was founded in 2014 and is based in Hamilton, Bermuda.
Latest AXON News From Around the Web
Below are the latest news stories about AXON ENTERPRISE INC that investors may wish to consider to help them evaluate AXON as an investment opportunity.
Investment Time Machine: 3 Growth Stocks for a Regret-Free 2033Despite the market's indecisiveness, there are still some great growth stocks to buy. |
Axon Enterprise (AXON) Dips More Than Broader Markets: What You Should KnowIn the latest trading session, Axon Enterprise (AXON) closed at $189.61, marking a -1.88% move from the previous day. |
Size Matters When Buying StocksIn today’s Market360, we’ll reveal the real reason why the PPI disappointed this week. |
Taser Stock Axon Enterprise Tests Key Level As New Buy Point LoomsAxon Enterprise, the maker of the Taser stun gun, is one of the top stocks to watch. Taser stock has a new entry in today's stock market. |
Axon Enterprise (AXON) Stock Moves -0.22%: What You Should KnowIn the latest trading session, Axon Enterprise (AXON) closed at $203.35, marking a -0.22% move from the previous day. |
AXON Price Returns
1-mo | -7.61% |
3-mo | N/A |
6-mo | -8.42% |
1-year | 71.91% |
3-year | 117.36% |
5-year | N/A |
YTD | 19.92% |
2022 | 5.69% |
2021 | 28.13% |
2020 | N/A |
2019 | N/A |
2018 | N/A |
Loading social stream, please wait...