
Axsome Therapeutics, Inc. (AXSM): Price and Financial Metrics
AXSM Price/Volume Stats
| Current price | $86.53 | 52-week high | $98.40 |
| Prev. close | $85.98 | 52-week low | $55.02 |
| Day low | $85.05 | Volume | 262,200 |
| Day high | $86.93 | Avg. volume | 706,856 |
| 50-day MA | $78.50 | Dividend yield | N/A |
| 200-day MA | $75.90 | Market Cap | 4.11B |
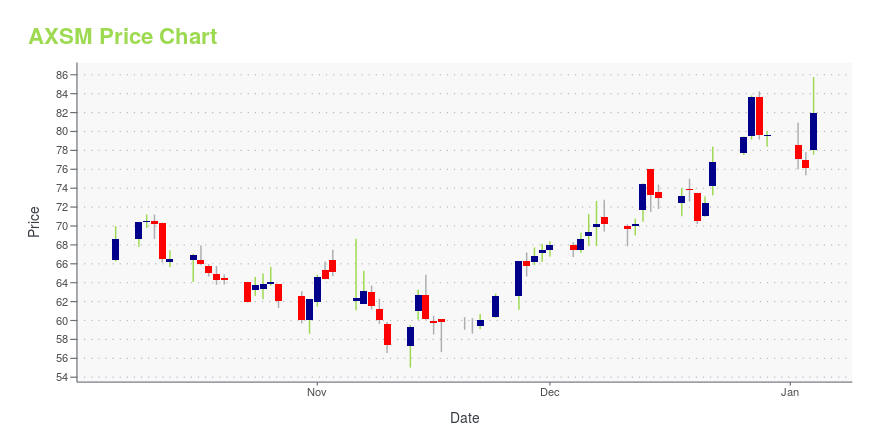
AXSM Stock Price Chart Interactive Chart >
Axsome Therapeutics, Inc. (AXSM) Company Bio
Axsome Therapeutics Inc. focuses on developing therapies for the management of pain, neurological disorders, and other central nervous system. The company was founded in 2012 and is based in New York City, New York.
Latest AXSM News From Around the Web
Below are the latest news stories about AXSOME THERAPEUTICS INC that investors may wish to consider to help them evaluate AXSM as an investment opportunity.
Axsome Therapeutics Presents New Data and Post-Hoc Analyses of Auvelity® in Patients with Major Depressive Disorder at the American College of Neuropsychopharmacology (ACNP) 2023 Annual MeetingNew data on Auvelity’s impact on quality of life, measured by the Q-LES-Q-SF, in patients who had received at least one prior treatment during their current depressive episode Data on Auvelity exploring reduction of depressive symptoms regardless of a patient’s interest-activity symptom severity NEW YORK, Dec. 11, 2023 (GLOBE NEWSWIRE) -- Axsome Therapeutics, Inc. (NASDAQ: AXSM), a biopharmaceutical company developing and delivering novel therapies for the management of central nervous system (C |
3 Unstoppable Stocks to Buy Right NowHere's why they picked Axsome Therapeutics (NASDAQ: AXSM), Eli Lilly (NYSE: LLY), and Vertex Pharmaceuticals (NASDAQ: VRTX). David Jagielski (Axsome Therapeutics): One promising growth stock that investors may be overlooking today is Axsome Therapeutics. With a market capitalization of around $3.2 billion, this is still a fairly small biotech stock for investors to load up on before it gets much bigger. |
Axsome Therapeutics Hosts Solriamfetol Virtual Investor Event with Expert Thought Leaders TodayNEW YORK, Dec. 07, 2023 (GLOBE NEWSWIRE) -- Axsome Therapeutics, Inc. (NASDAQ: AXSM), a biopharmaceutical company developing and delivering novel therapies for the management of central nervous system (CNS) disorders, is hosting a virtual investor event and conference call today from 8 a.m. – 10 a.m. Eastern Time to provide an update on solriamfetol, a dual-acting dopamine and norepinephrine reuptake inhibitor (DNRI) and trace amine-associated receptor 1 (TAAR1) agonist. At the event, invited ph |
11 Best Upside Stocks To Buy Right NowIn this piece, we will take a look at the 11 best upside stocks to buy right now. If you want to skip our overview of share valuation, then take a look at the 5 Best Upside Stocks To Buy Now. The art of buying shares on the market has always gone hand in hand […] |
Axsome Therapeutics to Host Solriamfetol Virtual Investor Event on December 7NEW YORK, Nov. 22, 2023 (GLOBE NEWSWIRE) -- Axsome Therapeutics, Inc. (NASDAQ: AXSM), a biopharmaceutical company developing and delivering novel therapies for the management of central nervous system (CNS) disorders, today announced that it will host a virtual event on December 7 from 8 a.m. - 10 a.m. Eastern Time to provide investors an update on its development programs for solriamfetol, a dual-acting dopamine and norepinephrine reuptake inhibitor and trace amine-associated receptor 1 (TAAR1) |
AXSM Price Returns
| 1-mo | 12.20% |
| 3-mo | 20.67% |
| 6-mo | -3.68% |
| 1-year | 11.81% |
| 3-year | 64.32% |
| 5-year | 212.50% |
| YTD | 8.72% |
| 2023 | 3.19% |
| 2022 | 104.16% |
| 2021 | -53.63% |
| 2020 | -21.18% |
| 2019 | 3,565.25% |
Loading social stream, please wait...