Axalta Coating Systems Ltd. (AXTA): Price and Financial Metrics
AXTA Price/Volume Stats
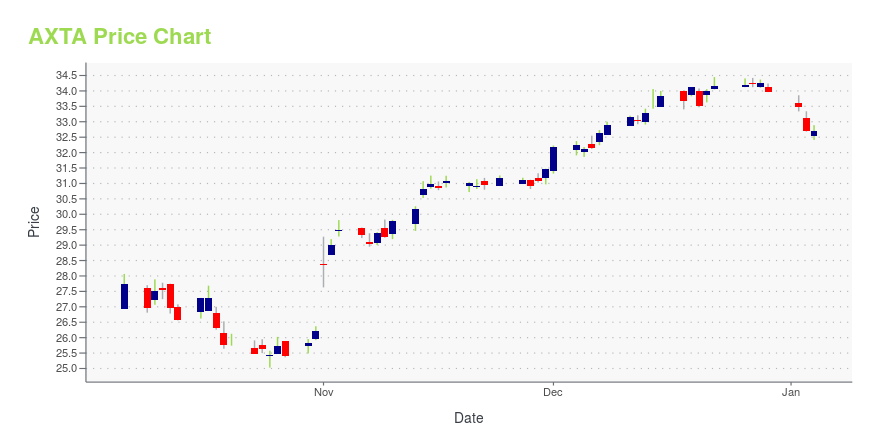
Current price | $32.13 | 52-week high | $33.68 |
Prev. close | $32.26 | 52-week low | $24.86 |
Day low | $31.86 | Volume | 2,540,600 |
Day high | $32.18 | Avg. volume | 2,425,073 |
50-day MA | $28.46 | Dividend yield | N/A |
200-day MA | $29.68 | Market Cap | 7.12B |
AXTA Stock Price Chart Interactive Chart >
AXTA POWR Grades
- Growth is the dimension where AXTA ranks best; there it ranks ahead of 84.76% of US stocks.
- The strongest trend for AXTA is in Quality, which has been heading up over the past 177 days.
- AXTA ranks lowest in Momentum; there it ranks in the 17th percentile.
AXTA Stock Summary
- With a market capitalization of $7,084,473,025, AXALTA COATING SYSTEMS LTD has a greater market value than 79.78% of US stocks.
- The capital turnover (annual revenue relative to shareholder's equity) for AXTA is 3.19 -- better than 83.22% of US stocks.
- In terms of volatility of its share price, AXTA is more volatile than only 19.51% of stocks we're observing.
- Stocks with similar financial metrics, market capitalization, and price volatility to AXALTA COATING SYSTEMS LTD are CMCO, HAYW, LXFR, TWI, and CREX.
- Visit AXTA's SEC page to see the company's official filings. To visit the company's web site, go to www.axalta.com.
AXTA Valuation Summary
- AXTA's price/earnings ratio is 28.7; this is 86.36% higher than that of the median Basic Materials stock.
- Over the past 110 months, AXTA's EV/EBIT ratio has gone down 19.
Below are key valuation metrics over time for AXTA.
Stock | Date | P/S | P/B | P/E | EV/EBIT |
---|---|---|---|---|---|
AXTA | 2023-11-29 | 1.3 | 4.3 | 28.7 | 19.3 |
AXTA | 2023-11-28 | 1.3 | 4.2 | 28.6 | 19.2 |
AXTA | 2023-11-27 | 1.3 | 4.3 | 28.8 | 19.3 |
AXTA | 2023-11-24 | 1.3 | 4.3 | 28.9 | 19.4 |
AXTA | 2023-11-22 | 1.3 | 4.2 | 28.6 | 19.3 |
AXTA | 2023-11-21 | 1.3 | 4.2 | 28.6 | 19.3 |
AXTA Growth Metrics
- Its 5 year net income to common stockholders growth rate is now at 238.32%.
- Its 5 year revenue growth rate is now at 4.75%.
- The year over year net cashflow from operations growth rate now stands at -13.57%.

The table below shows AXTA's growth in key financial areas (numbers in millions of US dollars).
Date | Revenue | Operating Cash Flow | Net Income to Common Stock |
---|---|---|---|
2022-12-31 | 4,884.4 | 293.8 | 191.6 |
2022-09-30 | 4,784.9 | 316.8 | 201.2 |
2022-06-30 | 4,634.8 | 379.8 | 207.9 |
2022-03-31 | 4,526.7 | 475.1 | 290.2 |
2021-12-31 | 4,416.2 | 558.6 | 263.9 |
2021-09-30 | 4,353.5 | 568.4 | 280.4 |
AXTA's Quality Factors
The “Quality” component of the POWR Ratings focuses on 31 different factors of a companies fundamentals and operational strength. Here are some key insights as we drill into the specifics of these quality attributes.- AXTA has a Quality Grade of C, ranking ahead of 70.87% of graded US stocks.
- AXTA's asset turnover comes in at 0.608 -- ranking 49th of 89 Chemicals stocks.
- ROG, PPG, and WLK are the stocks whose asset turnover ratios are most correlated with AXTA.
The table below shows AXTA's key quality metrics over time.
Period | Asset Turnover | Gross Margin | ROIC |
---|---|---|---|
2021-09-30 | 0.608 | 0.343 | 0.083 |
2021-06-30 | 0.604 | 0.359 | 0.085 |
2021-03-31 | 0.548 | 0.346 | 0.042 |
2020-12-31 | 0.549 | 0.342 | 0.044 |
2020-09-30 | 0.559 | 0.338 | 0.041 |
2020-06-30 | 0.578 | 0.333 | 0.038 |
Axalta Coating Systems Ltd. (AXTA) Company Bio
Axalta Coating Systems specializes in coatings used in light OEM vehicles, commercial vehicles and refinish applications to electric motors, buildings and pipelines. The company was founded in 1866 and is based in Philadelphia, Pennsylvania.
Latest AXTA News From Around the Web
Below are the latest news stories about AXALTA COATING SYSTEMS LTD that investors may wish to consider to help them evaluate AXTA as an investment opportunity.
Eastman Chemical (EMN) Wraps Up Sale of Texas City OperationsThe proceeds of the divestiture are expected to be used for debt repayment of Eastman (EMN) in the near future. |
Air Products (APD) Hits Milestone With 2,000th Seagoing VesselThe nitrogen generators that Air Products (APD) Membrane Solutions designed and produced at its facilities in Norway are currently being used by ships from more than 50 nations. |
SSR Mining (SSRM) Inks Deal to Sell San Luis Project for $43MSSR Mining (SSRM) enters a definitive agreement to sell its San Luis Project for portfolio optimization. |
Here's Why You Should Hold Onto Air Products (APD) for NowAir Products (APD) benefits from its investments in high-return industrial gas projects, productivity measures and higher prices. |
DuPont (DD) Attains Full Conversion to Low-GWP StyrofoamDuPont's (DD) joint efforts have considerably reduced the carbon footprint of its Styrofoam portfolio. |
AXTA Price Returns
1-mo | 8.95% |
3-mo | 18.30% |
6-mo | 1.45% |
1-year | 20.56% |
3-year | 9.47% |
5-year | 30.56% |
YTD | 26.15% |
2022 | -23.10% |
2021 | 16.01% |
2020 | -6.09% |
2019 | 29.80% |
2018 | -27.63% |
Continue Researching AXTA
Want to see what other sources are saying about Axalta Coating Systems Ltd's financials and stock price? Try the links below:Axalta Coating Systems Ltd (AXTA) Stock Price | Nasdaq
Axalta Coating Systems Ltd (AXTA) Stock Quote, History and News - Yahoo Finance
Axalta Coating Systems Ltd (AXTA) Stock Price and Basic Information | MarketWatch
Loading social stream, please wait...