AZEK Co. Inc. (AZEK): Price and Financial Metrics
GET POWR RATINGS... FREE!
AZEK POWR Grades
- AZEK scores best on the Momentum dimension, with a Momentum rank ahead of 65.88% of US stocks.
- The strongest trend for AZEK is in Growth, which has been heading down over the past 179 days.
- AZEK ranks lowest in Value; there it ranks in the 10th percentile.
AZEK Stock Summary
- AZEK's one year PEG ratio, measuring expected growth in earnings next year relative to current common stock price is 2.56 -- higher than just 11.22% of US-listed equities with positive expected earnings growth.
- AZEK Co Inc's stock had its IPO on June 12, 2020, making it an older stock than merely 4.54% of US equities in our set.
- Over the past twelve months, AZEK has reported earnings growth of 407.58%, putting it ahead of 94.71% of US stocks in our set.
- Stocks that are quantitatively similar to AZEK, based on their financial statements, market capitalization, and price volatility, are NOV, NR, VEC, AMSF, and AMPG.
- Visit AZEK's SEC page to see the company's official filings. To visit the company's web site, go to azekco.com.
AZEK Valuation Summary
- In comparison to the median Basic Materials stock, AZEK's EV/EBIT ratio is 1435.53% higher, now standing at 233.4.
- Over the past 15 months, AZEK's price/sales ratio has gone up 1.1.
- AZEK's EV/EBIT ratio has moved up 150.9 over the prior 15 months.
Below are key valuation metrics over time for AZEK.
Stock | Date | P/S | P/B | P/E | EV/EBIT |
---|---|---|---|---|---|
AZEK | 2021-09-03 | 6.0 | 4.7 | -671.0 | 233.4 |
AZEK | 2021-09-02 | 6.1 | 4.8 | -686.2 | 238.5 |
AZEK | 2021-09-01 | 6.1 | 4.8 | -683.8 | 237.7 |
AZEK | 2021-08-31 | 6.0 | 4.8 | -674.8 | 234.6 |
AZEK | 2021-08-30 | 6.0 | 4.8 | -680.3 | 236.5 |
AZEK | 2021-08-27 | 6.0 | 4.8 | -677.3 | 235.5 |
AZEK's Quality Factors
The “Quality” component of the POWR Ratings focuses on 31 different factors of a companies fundamentals and operational strength. Here are some key insights as we drill into the specifics of these quality attributes.- AZEK has a Quality Grade of D, ranking ahead of 23.86% of graded US stocks.
- AZEK's asset turnover comes in at 0.555 -- ranking 17th of 22 Rubber and Plastic Products stocks.
- 500 - Internal server error
The table below shows AZEK's key quality metrics over time.
Period | Asset Turnover | Gross Margin | ROIC |
---|---|---|---|
2021-06-30 | 0.555 | 0.336 | 0.032 |
2021-03-31 | 0.510 | 0.339 | -0.040 |
2020-09-30 | 0.483 | 0.329 | -0.054 |
2020-09-30 | 0.483 | 0.329 | -0.054 |
AZEK Stock Price Chart Interactive Chart >
AZEK Price/Volume Stats
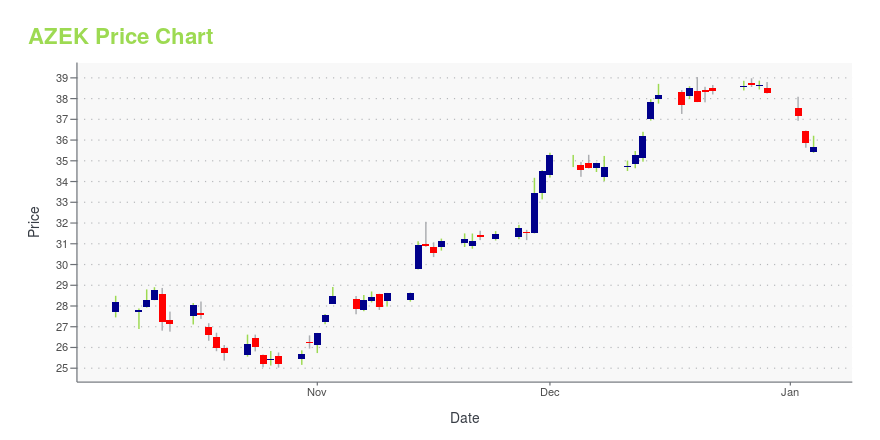
Current price | $19.17 | 52-week high | $46.56 |
Prev. close | $18.38 | 52-week low | $16.34 |
Day low | $18.37 | Volume | 1,812,100 |
Day high | $19.97 | Avg. volume | 2,161,880 |
50-day MA | $23.28 | Dividend yield | N/A |
200-day MA | $34.29 | Market Cap | 2.97B |
AZEK Co. Inc. (AZEK) Company Bio
The AZEK Co., Inc. is an industry manufacturer of premium building products that replace traditional materials and provide value through lower maintenance, refined aesthetics and reduced total cost. The company operates through two segments: Residential and Commercial. The Residential consumer consumer brands include TimberTech and AZEK Exteriors. The TimberTech offers a premium portfolio of capped polymer and capped composite decking as well as railing, porch, lighting and paver products. The AZEK Exteriors manufactures distinctly unique trim and moulding. The Commercial segment manufactures engineered sheet products and high-quality bathroom partitions and lockers. The company was founded on August 15, 2013 and is headquartered in Chicago, IL.
Latest AZEK News From Around the Web
Below are the latest news stories about AZEK Co Inc that investors may wish to consider to help them evaluate AZEK as an investment opportunity.
The AZEK Company Announces Upcoming Investor Conference ScheduleCHICAGO, February 18, 2022--The AZEK Company Inc. (the "Company" or "AZEK") (NYSE: AZEK), the industry-leading manufacturer of beautiful, low-maintenance and environmentally sustainable outdoor living products, including TimberTech® decking, Versatex® and AZEK Trim® and StruXure™ pergolas, announced today its participation in the following investor conferences: |
Today’s Biggest Pre-Market Stock Movers: 10 Top Gainers and Losers on TuesdayWe've got another busy day of trading ahead of us and we're starting with the biggest pre-market stock movers for Tuesday! |
Strong Insider Buying Could Indicate a Bottom in These 2 StocksWe saw large market declines as 2022 got started – but the real story was the increase in volatility. Especially at the beginning of February, when the market losses leveled off, daily trading was characterized by strong swings up and down. It’s a situation that puts a burden on investors, to recognize the right time to buy in for optimal profits. The key is not to try and ‘time’ it on daily trading, but to look at longer trends and future predictors. One place to find indicators toward a stock’ |
Repair-and-Remodeling Stock Rally Hits a Wall as Fed Looms(Bloomberg) -- Makers of everything from decks to porches and outdoor lighting are lagging behind the broader stock market this year, joining a selloff in homebuilder shares as casualties of a rising-rate environment.Most Read from BloombergAmazon Is Raising Base Salary Cap to $350,000 From $160,000We’re Fine Without Facebook, German and French Ministers SayByron Allen Says He’s Preparing Bid for NFL’s Denver BroncosDOJ Seizes $3.6 Billion in Bitcoin Stolen in Bitfinex HackOttawa Declares Emerge |
Phoenix Holdings Ltd. Buys Global X The Global X Cybersecurity ETF, FMC Corp, Univar Solutions ...Investment company Phoenix Holdings Ltd. (Current Portfolio) buys Global X The Global X Cybersecurity ETF, FMC Corp, Univar Solutions Inc, Meta Platforms Inc, PPG Industries Inc, sells SPDR S&P Regional Banking ETF, Global X Copper Miners ETF, Defiance Next Gen Connectivity ETF, Alcoa Corp, ETFMG Prime Cyber Security ETF during the 3-months ended 2021Q4, according to the most recent filings of the investment company, Phoenix Holdings Ltd.. |
AZEK Price Returns
1-mo | -11.00% |
3-mo | -33.94% |
6-mo | -53.48% |
1-year | -55.95% |
3-year | N/A |
5-year | N/A |
YTD | -58.54% |
2021 | 20.26% |
2020 | N/A |
2019 | N/A |
2018 | N/A |
2017 | N/A |
Loading social stream, please wait...