AstraZeneca PLC ADR (AZN): Price and Financial Metrics
GET POWR RATINGS... FREE!
AZN POWR Grades
- Sentiment is the dimension where AZN ranks best; there it ranks ahead of 93.37% of US stocks.
- The strongest trend for AZN is in Stability, which has been heading up over the past 177 days.
- AZN ranks lowest in Momentum; there it ranks in the 7th percentile.
AZN Stock Summary
- AZN has a market capitalization of $210,493,840,075 -- more than approximately 99.27% of US stocks.
- With a price/earnings ratio of 64.02, ASTRAZENECA PLC P/E ratio is greater than that of about 91.66% of stocks in our set with positive earnings.
- In terms of twelve month growth in earnings before interest and taxes, ASTRAZENECA PLC is reporting a growth rate of 272.29%; that's higher than 94.53% of US stocks.
- Stocks that are quantitatively similar to AZN, based on their financial statements, market capitalization, and price volatility, are PFE, CSCO, NVS, BABA, and ADBE.
- Visit AZN's SEC page to see the company's official filings. To visit the company's web site, go to www.astrazeneca.com.
AZN Valuation Summary
- AZN's EV/EBIT ratio is 60.8; this is 821.21% higher than that of the median Healthcare stock.
- Over the past 243 months, AZN's price/earnings ratio has gone up 42.7.
Below are key valuation metrics over time for AZN.
Stock | Date | P/S | P/B | P/E | EV/EBIT |
---|---|---|---|---|---|
AZN | 2023-03-24 | 4.7 | 5.7 | 64.0 | 60.8 |
AZN | 2023-03-23 | 4.7 | 5.6 | 63.4 | 60.3 |
AZN | 2023-03-22 | 4.7 | 5.6 | 62.8 | 59.7 |
AZN | 2023-03-21 | 4.7 | 5.6 | 63.2 | 60.0 |
AZN | 2023-03-20 | 4.7 | 5.6 | 62.9 | 59.8 |
AZN | 2023-03-17 | 4.6 | 5.5 | 61.9 | 58.9 |
AZN Growth Metrics
- Its 3 year price growth rate is now at 74.78%.
- Its 3 year cash and equivalents growth rate is now at 39.31%.
- The 2 year cash and equivalents growth rate now stands at 68.83%.

The table below shows AZN's growth in key financial areas (numbers in millions of US dollars).
Date | Revenue | Operating Cash Flow | Net Income to Common Stock |
---|---|---|---|
2022-12-31 | 44,351 | 9,808 | 3,288 |
2022-12-31 | 44,351 | 9,808 | 3,288 |
2022-09-30 | 45,154 | 8,828 | 2,039 |
2022-06-30 | 44,038 | 7,617 | -1,253 |
2022-03-31 | 41,487 | 7,261 | -1,063 |
2021-12-31 | 37,417 | 5,963 | 112 |
AZN's Quality Factors
The “Quality” component of the POWR Ratings focuses on 31 different factors of a companies fundamentals and operational strength. Here are some key insights as we drill into the specifics of these quality attributes.- AZN has a Quality Grade of B, ranking ahead of 78.56% of graded US stocks.
- AZN's asset turnover comes in at 0.438 -- ranking 104th of 681 Pharmaceutical Products stocks.
- CLVS, HSKA, and FLXN are the stocks whose asset turnover ratios are most correlated with AZN.
The table below shows AZN's key quality metrics over time.
Period | Asset Turnover | Gross Margin | ROIC |
---|---|---|---|
2021-06-30 | 0.438 | 0.765 | 0.209 |
2021-03-31 | 0.431 | 0.792 | 0.231 |
2020-12-31 | 0.429 | 0.801 | 0.205 |
2020-09-30 | 0.427 | 0.801 | 0.174 |
2020-06-30 | 0.433 | 0.800 | 0.161 |
2020-03-31 | 0.422 | 0.794 | 0.126 |
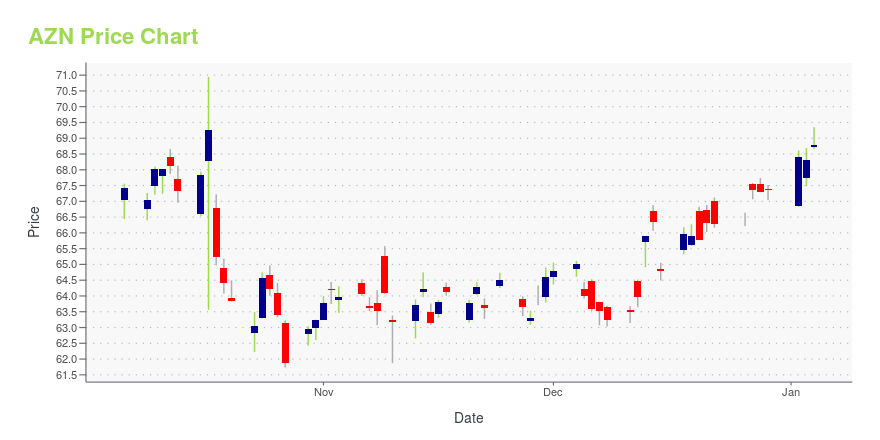
AZN Stock Price Chart Interactive Chart >
AZN Price/Volume Stats
Current price | $69.46 | 52-week high | $72.12 |
Prev. close | $69.20 | 52-week low | $52.65 |
Day low | $69.42 | Volume | 1,513,892 |
Day high | $69.93 | Avg. volume | 5,119,853 |
50-day MA | $66.50 | Dividend yield | 2.81% |
200-day MA | $64.43 | Market Cap | 215.30B |
AstraZeneca PLC ADR (AZN) Company Bio
AstraZeneca plc engages in the discovery, development, and commercialization of prescription medicines for the treatment of cardiovascular, metabolic, respiratory, inflammation, autoimmune, oncology, infection, and neuroscience diseases worldwide. The company was founded in 1992 and is based in London, the United Kingdom.
Latest AZN News From Around the Web
Below are the latest news stories about ASTRAZENECA PLC that investors may wish to consider to help them evaluate AZN as an investment opportunity.
Pieris Pharma Pushes Elarekibep Data Readout, Investors React NegativelyPieris Pharmaceuticals Inc (NASDAQ: PIRS) reported Q4 earnings and provided updates across its pipeline. The investors are reacting to the further pushback of the timeline for the readout from the Phase 2a study of elarekibep to mid-2024 from prior guidance of the third quarter of 2023. Pieris is collaborating with AstraZeneca Plc (NASDAQ: AZN) to develop elarekibep for asthma patients. AstraZeneca has communicated that completion of the Phase 2a study remains an important priority and that addi |
AstraZeneca-Ionis Partnered Rare Disease Drug Data Shows Sustained Benefit; Drug Under FDA ReviewIonis Pharmaceuticals Inc (NASDAQ: IONS) released topline results from the 66-week analysis of Phase 3 NEURO-TTRansform study of Ionis and AstraZeneca Plc's (NASDAQ: AZN) eplontersen in patients with hereditary transthyretin-mediated amyloid polyneuropathy (ATTRv-PN) that leads to peripheral nerve damage and motor disability. At 66 weeks, patients treated with eplontersen demonstrated a statistically significant and clinically meaningful change from baseline versus an external placebo group on t |
Ionis (IONS) Posts New Upbeat Data From Amyloidosis Drug StudyIonis (IONS) reports positive long-term phase III study data, supporting the benefits of eplontersen as a treatment for hereditary transthyretin-mediated amyloid polyneuropathy (ATTRv-PN). |
Eplontersen demonstrated sustained benefit in Phase III trial for hereditary transthyretin-mediated amyloid polyneuropathy (ATTRv-PN) through 66 weeksWILMINGTON, Del., March 27, 2023--Positive high-level results from the NEURO-TTRansform Phase III trial in patients with hereditary transthyretin-mediated amyloid polyneuropathy (ATTRv-PN) showed eplontersen met its co-primary endpoints through 66 weeks. The results were consistent with the positive 35-week findings announced in June 2022.1 |
Regeneron's (REGN) Dupixent Meets Pivotal COPD Study Goal, Up 7%Regeneron's (REGN) share price rose after it reported data from a late-stage study showing that treatment with Dupixent led to a 30% decline in chronic obstructive pulmonary disease exacerbations. |
AZN Price Returns
1-mo | 6.52% |
3-mo | 3.90% |
6-mo | 28.46% |
1-year | 6.93% |
3-year | 67.04% |
5-year | 127.26% |
YTD | 3.90% |
2022 | 19.10% |
2021 | 19.66% |
2020 | 3.06% |
2019 | 35.58% |
2018 | 13.77% |
AZN Dividends
Ex-Dividend Date | Type | Payout Amount | Change | ||||||
---|---|---|---|---|---|---|---|---|---|
Loading, please wait... |
Continue Researching AZN
Here are a few links from around the web to help you further your research on Astrazeneca Plc's stock as an investment opportunity:Astrazeneca Plc (AZN) Stock Price | Nasdaq
Astrazeneca Plc (AZN) Stock Quote, History and News - Yahoo Finance
Astrazeneca Plc (AZN) Stock Price and Basic Information | MarketWatch
Loading social stream, please wait...