Barnes Group, Inc. (B): Price and Financial Metrics
GET POWR RATINGS... FREE!
B POWR Grades
- B scores best on the Momentum dimension, with a Momentum rank ahead of 76.79% of US stocks.
- B's strongest trending metric is Value; it's been moving down over the last 178 days.
- B ranks lowest in Growth; there it ranks in the 35th percentile.
B Stock Summary
- B's went public 37.24 years ago, making it older than 93.42% of listed US stocks we're tracking.
- With a price/earnings ratio of 141.87, BARNES GROUP INC P/E ratio is greater than that of about 96.8% of stocks in our set with positive earnings.
- The price/operating cash flow metric for BARNES GROUP INC is higher than 80.83% of stocks in our set with a positive cash flow.
- Stocks that are quantitatively similar to B, based on their financial statements, market capitalization, and price volatility, are CFB, IBTX, HLMN, BMRC, and GNW.
- Visit B's SEC page to see the company's official filings. To visit the company's web site, go to www.barnesgroupinc.com.
B Valuation Summary
- In comparison to the median Industrials stock, B's price/sales ratio is 36.36% higher, now standing at 1.5.
- Over the past 243 months, B's EV/EBIT ratio has gone up 32.5.
Below are key valuation metrics over time for B.
Stock | Date | P/S | P/B | P/E | EV/EBIT |
---|---|---|---|---|---|
B | 2023-03-17 | 1.5 | 1.4 | 141.9 | 45.6 |
B | 2023-03-16 | 1.5 | 1.4 | 143.7 | 46.0 |
B | 2023-03-15 | 1.5 | 1.4 | 142.4 | 45.7 |
B | 2023-03-14 | 1.6 | 1.5 | 145.8 | 46.6 |
B | 2023-03-13 | 1.5 | 1.4 | 142.9 | 45.8 |
B | 2023-03-10 | 1.5 | 1.5 | 145.1 | 46.4 |
B Growth Metrics
- Its 2 year net income to common stockholders growth rate is now at -34.47%.
- Its year over year cash and equivalents growth rate is now at -11.36%.
- Its 4 year net cashflow from operations growth rate is now at 1.28%.

The table below shows B's growth in key financial areas (numbers in millions of US dollars).
Date | Revenue | Operating Cash Flow | Net Income to Common Stock |
---|---|---|---|
2022-12-31 | 1,261.868 | 75.559 | 13.479 |
2022-09-30 | 1,259.395 | 83.478 | 26.048 |
2022-06-30 | 1,269.71 | 90.604 | 36.932 |
2022-03-31 | 1,269.6 | 122.881 | 100.975 |
2021-12-31 | 1,258.846 | 167.806 | 99.873 |
2021-09-30 | 1,236.971 | 179.845 | 89.453 |
B's Quality Factors
The “Quality” component of the POWR Ratings focuses on 31 different factors of a companies fundamentals and operational strength. Here are some key insights as we drill into the specifics of these quality attributes.- B has a Quality Grade of B, ranking ahead of 75.53% of graded US stocks.
- B's asset turnover comes in at 0.472 -- ranking 54th of 60 Construction Materials stocks.
- SNA, CSTE, and CRH are the stocks whose asset turnover ratios are most correlated with B.
The table below shows B's key quality metrics over time.
Period | Asset Turnover | Gross Margin | ROIC |
---|---|---|---|
2021-09-30 | 0.472 | 0.360 | 0.102 |
2021-06-30 | 0.449 | 0.353 | 0.092 |
2021-03-31 | 0.418 | 0.354 | 0.072 |
2020-12-31 | 0.427 | 0.359 | 0.081 |
2020-09-30 | 0.455 | 0.370 | 0.098 |
2020-06-30 | 0.489 | 0.376 | 0.116 |
B Price Target
For more insight on analysts targets of B, see our B price target page. And for a list of of all stocks sorted by upside potential based on analyst target price, see our Top Price Target page.
Average Price Target | $57.80 | Average Broker Recommendation | 1.6 (Moderate Buy) |
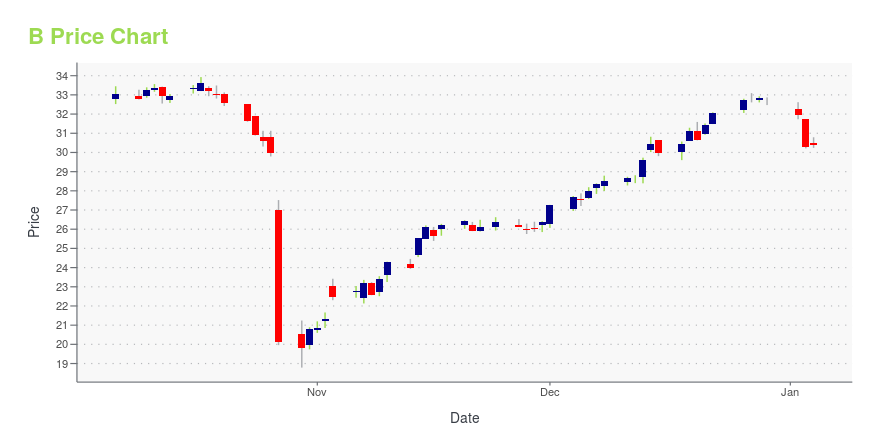
B Stock Price Chart Interactive Chart >
B Price/Volume Stats
Current price | $38.62 | 52-week high | $47.36 |
Prev. close | $37.95 | 52-week low | $27.93 |
Day low | $38.43 | Volume | 204,684 |
Day high | $39.18 | Avg. volume | 223,916 |
50-day MA | $42.59 | Dividend yield | 1.69% |
200-day MA | $36.68 | Market Cap | 1.95B |
Barnes Group, Inc. (B) Company Bio
Barnes Group operates as an industrial and aerospace manufacturer and service provider serving a range of end markets and customers worldwide. The company operates in two segments, Industrial and Aerospace. The company was founded in 1857 and is based in Bristol, Connecticut.
Latest B News From Around the Web
Below are the latest news stories about BARNES GROUP INC that investors may wish to consider to help them evaluate B as an investment opportunity.
5 Undervalued Insurance Stocks with High Dividend Yields and Low Payout RatiosInsurance stocks are now bargains because investment returns are down and costs are up, but their dividends make them solid bets. |
Why Are Energy Stocks Down Today?With fears of a banking sector contagion spreading to other parts of the economy, the inquiry why are energy stocks down today picked up. |
3 Dividend-Paying Growth Stocks to Load Up On Right NowThese three dividend-paying growth stocks provide the right mix of income and capital appreciation for most investors. |
Barnes Announces First Quarter 2023 Earnings Conference Call and WebcastBRISTOL, Conn., March 15, 2023--Barnes Group Inc. (NYSE: B) today announced it will release first quarter 2023 financial results on Thursday, April 27, 2023, before the market opens. |
3 Stocks that Warren Buffett Believes Are the FutureThese three stocks are each top picks of Warren Buffett for a reason, and long-term investors should certainly take note. |
B Price Returns
1-mo | -10.82% |
3-mo | -3.06% |
6-mo | 31.90% |
1-year | -6.28% |
3-year | 23.20% |
5-year | -31.12% |
YTD | -5.10% |
2022 | -10.81% |
2021 | -6.88% |
2020 | -16.97% |
2019 | 16.92% |
2018 | -14.41% |
B Dividends
Ex-Dividend Date | Type | Payout Amount | Change | ||||||
---|---|---|---|---|---|---|---|---|---|
Loading, please wait... |
Continue Researching B
Want to see what other sources are saying about Barnes Group Inc's financials and stock price? Try the links below:Barnes Group Inc (B) Stock Price | Nasdaq
Barnes Group Inc (B) Stock Quote, History and News - Yahoo Finance
Barnes Group Inc (B) Stock Price and Basic Information | MarketWatch
Loading social stream, please wait...