
Boeing Co. (BA): Price and Financial Metrics
BA Price/Volume Stats
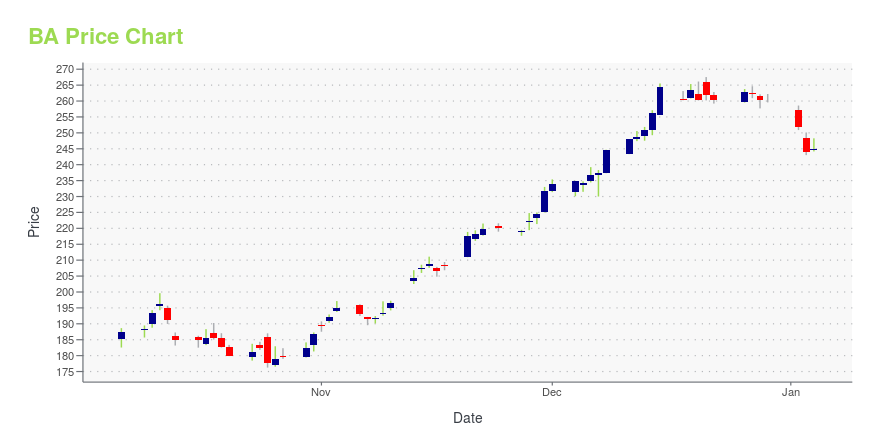
| Current price | $186.89 | 52-week high | $267.54 |
| Prev. close | $184.35 | 52-week low | $159.70 |
| Day low | $184.63 | Volume | 6,271,900 |
| Day high | $189.59 | Avg. volume | 8,159,398 |
| 50-day MA | $181.95 | Dividend yield | N/A |
| 200-day MA | $197.99 | Market Cap | 114.73B |
BA Stock Price Chart Interactive Chart >
Boeing Co. (BA) Company Bio
Headquartered in Chicago, Illinois, Boeing Co. is the world's largest aerospace company and leading manufacturer of commercial jetliners, defense, space and security systems, and service provider of aftermarket support. As America’s biggest manufacturing exporter, the company supports airlines and U.S. and allied government customers in more than 150 countries around the world. The company has manufacturing, service and technology partnerships with companies and governments worldwide and contracts with more than 20,000 diverse suppliers and partners. Boeing products and tailored services include commercial and military aircraft, satellites, weapons, electronic and defense systems, launch systems, advanced information and communication systems, and performance-based logistics and training.
Latest BA News From Around the Web
Below are the latest news stories about BOEING CO that investors may wish to consider to help them evaluate BA as an investment opportunity.
Boeing Stock Price Had A Good 2023: Will 2024 Be Even Better?Boeing share price rose by over 33% in 2023. |
US STOCKS-S&P 500 ekes out meager gains, flirts with bull market confirmationThe S&P 500 closed nominally higher on Thursday, retracing early gains just before the closing bell on the penultimate trading day of 2023. The blue-chip Dow ended modestly green, notching its second record-high closing level in a row, while the Nasdaq finished a hair lower. |
ARK's crypto moves, Boeing, Mullen Automotive: Trending tickersCathie Wood's Ark Invest has made some changes in its Next Generation Internet ETF (ARKW), exiting its position in the Grayscale Bitcoin Trust (GBTC) and buying the ProShares Bitcoin Strategy ETF (BITO). Wood says that the move was made in case the Grayscale Bitcoin Trust conversion to an ETF is not approved by the Securities and Exchange Commission. In an interview with Yahoo Finance earlier this week, Wood says she expects the SEC to approve a number of spot bitcoin ETFs all at once when a deadline is reached next month. Boeing (BA) has urged airlines to inspect 737 Max jets over a potential loose bolt. EV startup Mullen Automotive (MULN) saw its stock jump after announcing delivery of 50 electric cargo vans to a dealership group for $1.7 million. For more expert insight and the late... |
Boeing, FAA urge operators to inspect 737 MAX jets for loose boltBoeing and the Federal Aviation Administration are calling for airlines operating the 737 MAX to inspect the aircraft for a possible loose bolt in the jet's rudder control system. |
Boeing urges all airlines to inspect 737 MAX jetsTheStreet's J.D. Durkin brings the latest business headlines from the floor of the New York Stock Exchange as markets close for trading Thursday, December 28th. The Dow closed x, the Nasdaq closed x, and the S&P closed x. In other news, Boeing's 737 MAX jet is once again making headlines, and once again, it isn't for a good reason. |
BA Price Returns
| 1-mo | 4.70% |
| 3-mo | 11.76% |
| 6-mo | -9.04% |
| 1-year | -20.05% |
| 3-year | -15.92% |
| 5-year | -44.85% |
| YTD | -28.30% |
| 2023 | 36.84% |
| 2022 | -5.38% |
| 2021 | -5.95% |
| 2020 | -33.90% |
| 2019 | 3.34% |
Continue Researching BA
Want to do more research on Boeing Co's stock and its price? Try the links below:Boeing Co (BA) Stock Price | Nasdaq
Boeing Co (BA) Stock Quote, History and News - Yahoo Finance
Boeing Co (BA) Stock Price and Basic Information | MarketWatch
Loading social stream, please wait...