
BASF SE ADR (BASFY): Price and Financial Metrics
BASFY Price/Volume Stats
| Current price | $11.90 | 52-week high | $14.89 |
| Prev. close | $12.08 | 52-week low | $10.66 |
| Day low | $11.79 | Volume | 165,188 |
| Day high | $11.91 | Avg. volume | 138,560 |
| 50-day MA | $12.43 | Dividend yield | 5.35% |
| 200-day MA | $12.58 | Market Cap | 43.05B |
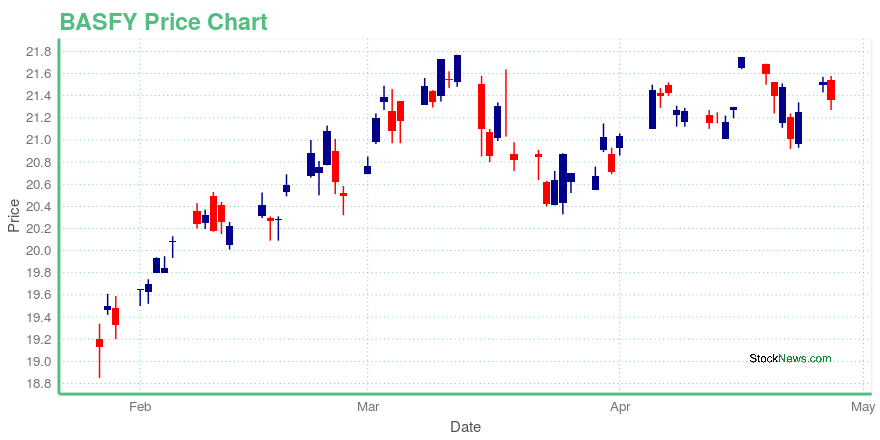
BASFY Stock Price Chart Interactive Chart >
BASF SE ADR (BASFY) Company Bio
BASF SE (German pronunciation: [beːaːɛsˈʔɛf] (listen)) is a German multinational chemical company and the largest chemical producer in the world. Its headquarter is located in Ludwigshafen, Germany.(Source:Wikipedia)
BASFY Price Returns
| 1-mo | -1.29% |
| 3-mo | -8.81% |
| 6-mo | 1.39% |
| 1-year | -4.10% |
| 3-year | -30.11% |
| 5-year | -13.87% |
| YTD | -6.92% |
| 2023 | 14.58% |
| 2022 | -26.24% |
| 2021 | -7.88% |
| 2020 | 9.92% |
| 2019 | 9.79% |
BASFY Dividends
| Ex-Dividend Date | Type | Payout Amount | Change | ||||||
|---|---|---|---|---|---|---|---|---|---|
| Loading, please wait... | |||||||||
Loading social stream, please wait...