BigBear.ai Holdings, Inc. (BBAI): Price and Financial Metrics
BBAI Price/Volume Stats
Current price | $1.40 | 52-week high | $6.77 |
Prev. close | $1.51 | 52-week low | $0.58 |
Day low | $1.35 | Volume | 2,727,500 |
Day high | $1.59 | Avg. volume | 7,304,536 |
50-day MA | $1.63 | Dividend yield | N/A |
200-day MA | $2.21 | Market Cap | 218.16M |
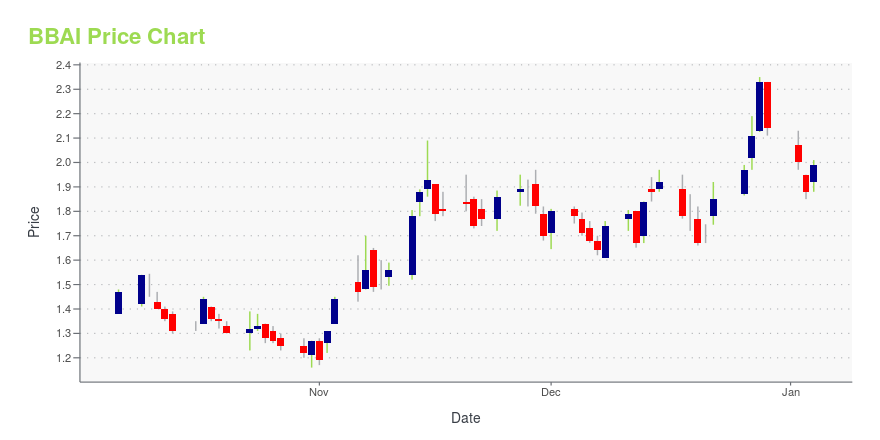
BBAI Stock Price Chart Interactive Chart >
BBAI POWR Grades
- Growth is the dimension where BBAI ranks best; there it ranks ahead of 48.29% of US stocks.
- The strongest trend for BBAI is in Growth, which has been heading down over the past 177 days.
- BBAI's current lowest rank is in the Sentiment metric (where it is better than 1.17% of US stocks).
BBAI Stock Summary
- The capital turnover (annual revenue relative to shareholder's equity) for BBAI is -2.62 -- better than only 3.95% of US stocks.
- BBAI's went public 2.63 years ago, making it older than only 9.16% of listed US stocks we're tracking.
- Equity multiplier, or assets relative to shareholders' equity, comes in at -5.11 for BIGBEARAI HOLDINGS INC; that's greater than it is for only 3.4% of US stocks.
- If you're looking for stocks that are quantitatively similar to BIGBEARAI HOLDINGS INC, a group of peers worth examining would be CREX, RDW, FSI, AYTU, and ADMA.
- BBAI's SEC filings can be seen here. And to visit BIGBEARAI HOLDINGS INC's official web site, go to www.gigcapital4.com.
BBAI Valuation Summary
- BBAI's price/sales ratio is 1.4; this is 41.67% lower than that of the median Technology stock.
- BBAI's EV/EBIT ratio has moved up 29.9 over the prior 32 months.
Below are key valuation metrics over time for BBAI.
Stock | Date | P/S | P/B | P/E | EV/EBIT |
---|---|---|---|---|---|
BBAI | 2023-09-22 | 1.4 | -3.6 | -2.5 | -5.2 |
BBAI | 2023-09-21 | 1.4 | -3.7 | -2.6 | -5.4 |
BBAI | 2023-09-20 | 1.5 | -4.0 | -2.8 | -5.6 |
BBAI | 2023-09-19 | 1.5 | -4.0 | -2.8 | -5.6 |
BBAI | 2023-09-18 | 1.6 | -4.1 | -2.9 | -5.7 |
BBAI | 2023-09-15 | 1.6 | -4.2 | -2.9 | -5.7 |
BigBear.ai Holdings, Inc. (BBAI) Company Bio
BigBear.ai Holdings, Inc. provides artificial intelligence, machine learning, cloud-based big data analytics, and cyber engineering solutions to the U.S. Intelligence Community, Department of Defense, and U.S. Federal Government, as well as commercial customers. Its AI-powered platform solutions include Observe for data ingestion and conflation, Orient for composable machine learning at scale, and Dominate for visual anticipatory intelligence and optimization. The company was founded in 2020 and is headquartered in Columbia, Maryland and has additional locations in Virginia, Massachusetts, Michigan, and California.
Latest BBAI News From Around the Web
Below are the latest news stories about BIGBEARAI HOLDINGS INC that investors may wish to consider to help them evaluate BBAI as an investment opportunity.
The 3 Most Undervalued AI Penny Stocks to Buy in September 2023These undervalued AI penny stocks offer tremendous long-term upside at incredibly attractive price points at this point |
These 2 AI Stocks Under $5 Have Triple-Digit Upside Potential, Says AnalystWe live in a digital world, powered by a digital economy, and that means that in the long term, we should look to the tech sector for strong stock results. Specifically, we need to be cognizant of AI. AI stocks have been in the public market for several years now, as the technology has made inroads into various niches – interactive chatbots, of course, but also autonomous vehicles, robotics, warehousing… even online content writing. There’s no doubt that AI is here to stay, and there’s no doubt |
BigBear.ai (BBAI) Stock Gains 15% on New ‘Buy’ RatingWith H.C. |
Oracle upgraded, Farfetch downgraded: Wall Street's top analyst callsOracle upgraded, Farfetch downgraded: Wall Street's top analyst calls |
The 3 Most Undervalued Machine Learning Stocks to Buy Now: August 2023Machine learning stocks still have a lot of room left to rise despite a short-term pullback in their stock prices. |
BBAI Price Returns
1-mo | -18.60% |
3-mo | -38.60% |
6-mo | -44.22% |
1-year | -13.04% |
3-year | N/A |
5-year | N/A |
YTD | 107.81% |
2022 | -88.10% |
2021 | N/A |
2020 | N/A |
2019 | N/A |
2018 | N/A |
Loading social stream, please wait...