Barings BDC, Inc. (BBDC): Price and Financial Metrics
BBDC Price/Volume Stats
Current price | $9.25 | 52-week high | $9.89 |
Prev. close | $9.18 | 52-week low | $6.96 |
Day low | $9.25 | Volume | 304,866 |
Day high | $9.31 | Avg. volume | 521,584 |
50-day MA | $9.18 | Dividend yield | 11.52% |
200-day MA | $8.80 | Market Cap | 981.12M |
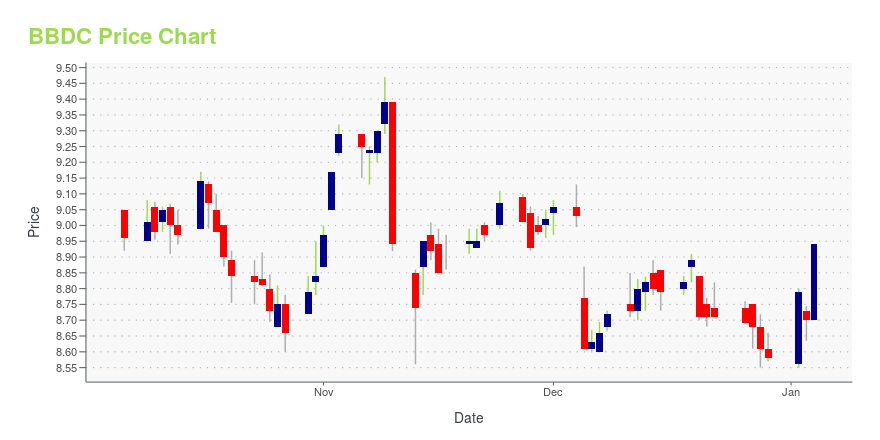
BBDC Stock Price Chart Interactive Chart >
BBDC POWR Grades
- BBDC scores best on the Momentum dimension, with a Momentum rank ahead of 74.09% of US stocks.
- The strongest trend for BBDC is in Sentiment, which has been heading down over the past 26 weeks.
- BBDC's current lowest rank is in the Quality metric (where it is better than 38.6% of US stocks).
BBDC Stock Summary
- For BBDC, its debt to operating expenses ratio is greater than that reported by 98.09% of US equities we're observing.
- Over the past twelve months, BBDC has reported earnings growth of 410.23%, putting it ahead of 97.14% of US stocks in our set.
- Revenue growth over the past 12 months for BARINGS BDC INC comes in at 43.98%, a number that bests 89.77% of the US stocks we're tracking.
- Stocks with similar financial metrics, market capitalization, and price volatility to BARINGS BDC INC are ACR, TWO, CMTG, KREF, and RC.
- Visit BBDC's SEC page to see the company's official filings. To visit the company's web site, go to www.baringsbdc.com.
BBDC Valuation Summary
- BBDC's price/earnings ratio is 9.6; this is 12.73% lower than that of the median Financial Services stock.
- Over the past 202 months, BBDC's price/sales ratio has gone down 9.8.
Below are key valuation metrics over time for BBDC.
Stock | Date | P/S | P/B | P/E | EV/EBIT |
---|---|---|---|---|---|
BBDC | 2023-12-22 | 3.4 | 0.8 | 9.6 | 24.8 |
BBDC | 2023-12-21 | 3.4 | 0.8 | 9.6 | 24.8 |
BBDC | 2023-12-20 | 3.4 | 0.8 | 9.6 | 24.8 |
BBDC | 2023-12-19 | 3.4 | 0.8 | 9.8 | 25.0 |
BBDC | 2023-12-18 | 3.4 | 0.8 | 9.7 | 24.9 |
BBDC | 2023-12-15 | 3.4 | 0.8 | 9.7 | 24.9 |
BBDC Growth Metrics
- The year over year net income to common stockholders growth rate now stands at -46.76%.
- Its 5 year revenue growth rate is now at -35.17%.
- The 2 year cash and equivalents growth rate now stands at 1326.52%.
The table below shows BBDC's growth in key financial areas (numbers in millions of US dollars).
Date | Revenue | Operating Cash Flow | Net Income to Common Stock |
---|---|---|---|
2022-09-30 | 192.2598 | -170.9987 | 17.41074 |
2022-06-30 | 170.9377 | -270.2324 | 21.92812 |
2022-03-31 | 148.4991 | -330.2722 | 76.22915 |
2021-12-31 | 135.3354 | -396.5524 | 77.68543 |
2021-09-30 | 118.6131 | -338.8273 | 88.9789 |
2021-06-30 | 99.95843 | -477.077 | 117.7461 |
BBDC's Quality Factors
The “Quality” component of the POWR Ratings focuses on 31 different factors of a companies fundamentals and operational strength. Here are some key insights as we drill into the specifics of these quality attributes.- BBDC has a Quality Grade of C, ranking ahead of 44.35% of graded US stocks.
- BBDC's asset turnover comes in at 0.062 -- ranking 69th of 428 Banking stocks.
- LOB, NBHC, and GLG are the stocks whose asset turnover ratios are most correlated with BBDC.
The table below shows BBDC's key quality metrics over time.
Period | Asset Turnover | Gross Margin | ROIC |
---|---|---|---|
2021-06-30 | 0.062 | 0.599 | 0.047 |
2021-03-31 | 0.058 | 0.573 | 0.065 |
2020-12-31 | 0.056 | 0.520 | 0.004 |
2020-09-30 | 0.060 | 0.496 | -0.002 |
2020-06-30 | 0.063 | 0.477 | -0.024 |
2020-03-31 | 0.063 | 0.476 | -0.048 |
Barings BDC, Inc. (BBDC) Company Bio
Barings BDC, Inc. (NYSE: BBDC) is a publicly traded, externally managed investment company that has elected to be treated as a business development company under the Investment Company Act of 1940. Barings BDC seeks to invest primarily in senior secured loans to private U.S. middle-market companies that operate across a wide range of industries. It specializes in mezzanine, leveraged buyouts, management buyouts, ESOPs, change of control transactions, acquisition financings, growth financing, and recapitalizations in lower middle market, mature, and later stage companies. Barings BDC's investment activities are managed by its investment adviser, Barings LLC, a leading global asset manager based in Charlotte, NC with over $335 billion of AUM firm-wide. For more information, visit www.baringsbdc.com.
Latest BBDC News From Around the Web
Below are the latest news stories about BARINGS BDC INC that investors may wish to consider to help them evaluate BBDC as an investment opportunity.
12 Cheap High Dividend Stocks To Buy Right NowIn this article, we discuss 12 cheap high dividend stocks to buy right now. You can skip our detailed analysis of dividend stocks and their performance over the years, and go directly to read 5 Cheap High Dividend Stocks To Buy Right Now. Dividend stocks have become increasingly popular. When considering investment in them, the […] |
Barings BDC, Inc. (NYSE:BBDC) Q3 2023 Earnings Call TranscriptBarings BDC, Inc. (NYSE:BBDC) Q3 2023 Earnings Call Transcript November 10, 2023 Operator: Greetings. At this time, I would like to welcome everyone to the Barings BDC Inc Conference call for the quarter ended September 30th, 2023. All participants are in a listen-only mode. A question-and-answer session will follow the company’s formal remarks. [Operator Instructions] […] |
Q3 2023 Barings BDC Inc Earnings CallQ3 2023 Barings BDC Inc Earnings Call |
Barings BDC, Inc. Reports Third Quarter 2023 Results and Announces Quarterly Cash Dividend of $0.26 Per ShareCHARLOTTE, N.C., November 09, 2023--Barings BDC, Inc. (NYSE: BBDC) ("Barings BDC" or the "Company") today reported its financial and operating results for the third quarter of 2023 and announced that the Company’s Board of Directors (the "Board") declared a quarterly cash dividend of $0.26 per share. |
Heartland Financial (HTLF) Q3 Earnings Surpass EstimatesHeartland Financial (HTLF) delivered earnings and revenue surprises of 0.90% and 1.97%, respectively, for the quarter ended September 2023. Do the numbers hold clues to what lies ahead for the stock? |
BBDC Price Returns
1-mo | -3.83% |
3-mo | 10.74% |
6-mo | 9.80% |
1-year | 33.90% |
3-year | 25.11% |
5-year | 45.69% |
YTD | 10.74% |
2023 | 18.53% |
2022 | -18.60% |
2021 | 29.31% |
2020 | -3.48% |
2019 | 20.40% |
BBDC Dividends
Ex-Dividend Date | Type | Payout Amount | Change | ||||||
---|---|---|---|---|---|---|---|---|---|
Loading, please wait... |
Continue Researching BBDC
Want to do more research on Barings BDC Inc's stock and its price? Try the links below:Barings BDC Inc (BBDC) Stock Price | Nasdaq
Barings BDC Inc (BBDC) Stock Quote, History and News - Yahoo Finance
Barings BDC Inc (BBDC) Stock Price and Basic Information | MarketWatch
Loading social stream, please wait...