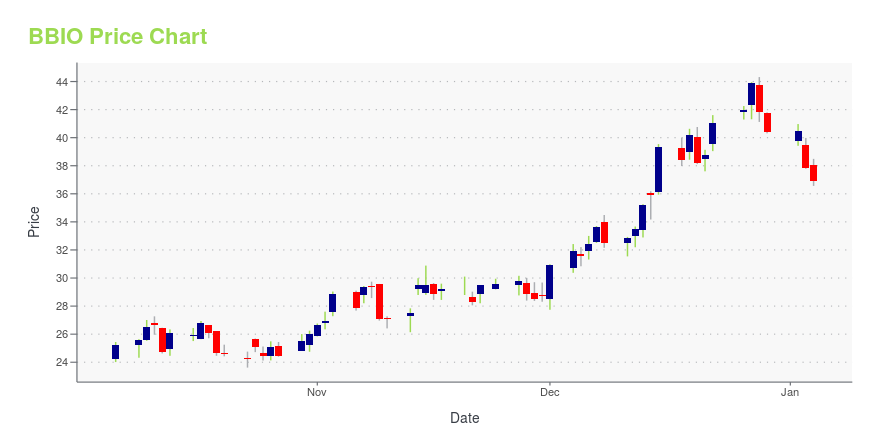
BridgeBio Pharma, Inc. (BBIO): Price and Financial Metrics
BBIO Price/Volume Stats
| Current price | $35.46 | 52-week high | $39.54 |
| Prev. close | $34.25 | 52-week low | $21.62 |
| Day low | $34.13 | Volume | 2,310,115 |
| Day high | $35.52 | Avg. volume | 3,040,143 |
| 50-day MA | $34.57 | Dividend yield | N/A |
| 200-day MA | $30.14 | Market Cap | 6.73B |
BBIO Stock Price Chart Interactive Chart >
BridgeBio Pharma, Inc. (BBIO) Company Bio
BridgeBio Pharma, Inc. engages in developing transformative medicines to treat patients who suffer from mendelian diseases. Its pipeline of 15 development programs includes product candidates from early discovery to late-stage development. The firm develops BBP-265, an oral small molecule transthyretin for the treatment of TTR amyloidosis, including cardiomyopathy and polyneuropathy manifestations; infigratinib, an oral FGFR1-3 selective tyrosine kinase inhibitor for the treatment of FGFR-driven cancers and in preclinical development for the treatment of achondroplasia; and BBP-631, a preclinical adeno-associated virus, gene transfer product candidate, for the treatment of congenital adrenal hyperplasia caused by 21OHD. The company was founded by Charles Homcy, Frank McCormick, Philip Reilly and Neil Kumar on May 17, 2019 and is headquartered in Palo Alto, CA.
BBIO Price Returns
| 1-mo | -8.06% |
| 3-mo | 5.72% |
| 6-mo | 30.85% |
| 1-year | 26.60% |
| 3-year | 391.14% |
| 5-year | 268.61% |
| YTD | 29.23% |
| 2024 | -32.03% |
| 2023 | 429.79% |
| 2022 | -54.32% |
| 2021 | -29.63% |
| 2020 | 102.88% |


Loading social stream, please wait...