Barrett Business Services, Inc. (BBSI): Price and Financial Metrics
BBSI Price/Volume Stats
Current price | $89.31 | 52-week high | $100.85 |
Prev. close | $88.88 | 52-week low | $75.94 |
Day low | $88.66 | Volume | 20,463 |
Day high | $89.49 | Avg. volume | 44,988 |
50-day MA | $93.26 | Dividend yield | 1.33% |
200-day MA | $90.76 | Market Cap | 601.06M |
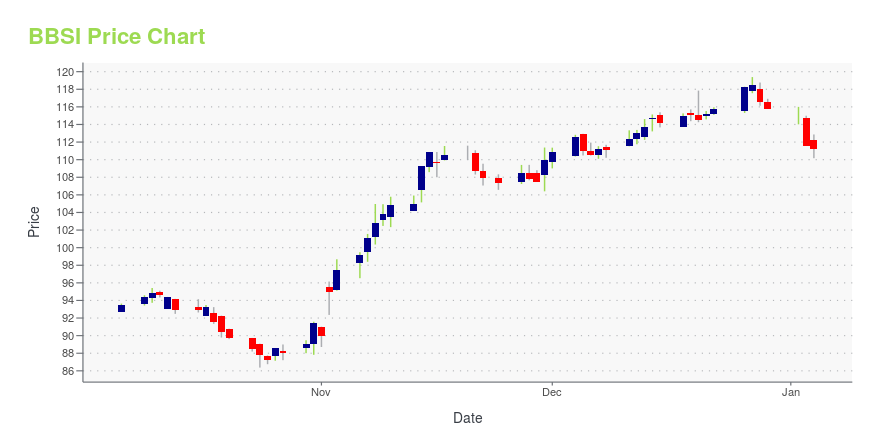
BBSI Stock Price Chart Interactive Chart >
BBSI POWR Grades
- BBSI scores best on the Sentiment dimension, with a Sentiment rank ahead of 97.79% of US stocks.
- BBSI's strongest trending metric is Stability; it's been moving up over the last 179 days.
- BBSI ranks lowest in Growth; there it ranks in the 36th percentile.
BBSI Stock Summary
- The capital turnover (annual revenue relative to shareholder's equity) for BBSI is 5.98 -- better than 92.73% of US stocks.
- For BBSI, its debt to operating expenses ratio is greater than that reported by merely 16.05% of US equities we're observing.
- The volatility of BARRETT BUSINESS SERVICES INC's share price is greater than that of only 9.8% US stocks with at least 200 days of trading history.
- Stocks with similar financial metrics, market capitalization, and price volatility to BARRETT BUSINESS SERVICES INC are ADUS, LRN, GO, RAVE, and GNE.
- Visit BBSI's SEC page to see the company's official filings. To visit the company's web site, go to mybbsi.com.
BBSI Valuation Summary
- In comparison to the median Industrials stock, BBSI's price/sales ratio is 68.42% lower, now standing at 0.6.
- Over the past 243 months, BBSI's price/sales ratio has gone up 0.1.
Below are key valuation metrics over time for BBSI.
Stock | Date | P/S | P/B | P/E | EV/EBIT |
---|---|---|---|---|---|
BBSI | 2023-09-15 | 0.6 | 3.5 | 13.2 | 6.1 |
BBSI | 2023-09-14 | 0.6 | 3.6 | 13.5 | 6.4 |
BBSI | 2023-09-13 | 0.6 | 3.6 | 13.5 | 6.3 |
BBSI | 2023-09-12 | 0.6 | 3.6 | 13.7 | 6.4 |
BBSI | 2023-09-11 | 0.6 | 3.6 | 13.6 | 6.4 |
BBSI | 2023-09-08 | 0.6 | 3.6 | 13.7 | 6.5 |
BBSI Growth Metrics
- The 4 year price growth rate now stands at -23.62%.
- Its year over year net cashflow from operations growth rate is now at -2.56%.
- Its 3 year net cashflow from operations growth rate is now at -136.78%.

The table below shows BBSI's growth in key financial areas (numbers in millions of US dollars).
Date | Revenue | Operating Cash Flow | Net Income to Common Stock |
---|---|---|---|
2022-09-30 | 1,038.944 | 41.786 | 46.354 |
2022-06-30 | 1,012.072 | -55.496 | 43.845 |
2022-03-31 | 983.096 | -37.784 | 42.921 |
2021-12-31 | 955.166 | -15.459 | 38.079 |
2021-09-30 | 931.774 | -9.358 | 34.616 |
2021-06-30 | 912.337 | 89.095 | 38.198 |
BBSI's Quality Factors
The “Quality” component of the POWR Ratings focuses on 31 different factors of a companies fundamentals and operational strength. Here are some key insights as we drill into the specifics of these quality attributes.- BBSI has a Quality Grade of C, ranking ahead of 58.27% of graded US stocks.
- BBSI's asset turnover comes in at 1.104 -- ranking 106th of 561 Business Services stocks.
- ENV, QMCI, and EXEL are the stocks whose asset turnover ratios are most correlated with BBSI.
The table below shows BBSI's key quality metrics over time.
Period | Asset Turnover | Gross Margin | ROIC |
---|---|---|---|
2021-06-30 | 1.104 | 0.218 | 0.990 |
2021-03-31 | 1.096 | 0.213 | 0.766 |
2020-12-31 | 1.091 | 0.208 | 1.010 |
2020-09-30 | 1.077 | 0.208 | 1.385 |
2020-06-30 | 1.086 | 0.216 | 2.065 |
2020-03-31 | 1.102 | 0.218 | 4.326 |
BBSI Price Target
For more insight on analysts targets of BBSI, see our BBSI price target page. And for a list of of all stocks sorted by upside potential based on analyst target price, see our Top Price Target page.
Average Price Target | $90.25 | Average Broker Recommendation | 1.25 (Strong Buy) |
Barrett Business Services, Inc. (BBSI) Company Bio
Barrett Business Services is a provider of business management solutions, combining human resource outsourcing and professional management consulting. The company was founded in 1965 and is based in Vancouver, Washington.
Latest BBSI News From Around the Web
Below are the latest news stories about BARRETT BUSINESS SERVICES INC that investors may wish to consider to help them evaluate BBSI as an investment opportunity.
Royce Investment Partners Commentary: A Deep Dive Into 2 Quality Value HoldingsBy Miles Lewis, CFA and Joesph HIntz, CFA |
Is Now The Time To Look At Buying Barrett Business Services, Inc. (NASDAQ:BBSI)?Barrett Business Services, Inc. ( NASDAQ:BBSI ), is not the largest company out there, but it saw a double-digit share... |
This Barrett Business Services Insider Increased Their Holding By 20% Last YearLooking at Barrett Business Services, Inc.'s ( NASDAQ:BBSI ) insider transactions over the last year, we can see that... |
Here's What We Like About Barrett Business Services' (NASDAQ:BBSI) Upcoming DividendReaders hoping to buy Barrett Business Services, Inc. ( NASDAQ:BBSI ) for its dividend will need to make their move... |
Barrett Business Services (NASDAQ:BBSI) Has Affirmed Its Dividend Of $0.30The board of Barrett Business Services, Inc. ( NASDAQ:BBSI ) has announced that it will pay a dividend of $0.30 per... |
BBSI Price Returns
1-mo | -6.65% |
3-mo | 4.70% |
6-mo | 4.01% |
1-year | 14.49% |
3-year | 84.88% |
5-year | 51.98% |
YTD | -3.26% |
2022 | 37.09% |
2021 | 2.91% |
2020 | -22.92% |
2019 | 60.10% |
2018 | -10.09% |
BBSI Dividends
Ex-Dividend Date | Type | Payout Amount | Change | ||||||
---|---|---|---|---|---|---|---|---|---|
Loading, please wait... |
Continue Researching BBSI
Want to see what other sources are saying about Barrett Business Services Inc's financials and stock price? Try the links below:Barrett Business Services Inc (BBSI) Stock Price | Nasdaq
Barrett Business Services Inc (BBSI) Stock Quote, History and News - Yahoo Finance
Barrett Business Services Inc (BBSI) Stock Price and Basic Information | MarketWatch
Loading social stream, please wait...