Boise Cascade, L.L.C. (BCC): Price and Financial Metrics
GET POWR RATINGS... FREE!
BCC POWR Grades
- BCC scores best on the Value dimension, with a Value rank ahead of 98.88% of US stocks.
- The strongest trend for BCC is in Growth, which has been heading up over the past 179 days.
- BCC ranks lowest in Stability; there it ranks in the 19th percentile.
BCC Stock Summary
- The capital turnover (annual revenue relative to shareholder's equity) for BCC is 5.86 -- better than 93.88% of US stocks.
- BCC's current price/earnings ratio is 4.15, which is higher than only 4.29% of US stocks with positive earnings.
- With a price/sales ratio of 0.37, BOISE CASCADE Co has a higher such ratio than merely 7.48% of stocks in our set.
- Stocks that are quantitatively similar to BCC, based on their financial statements, market capitalization, and price volatility, are BNED, UNVR, GMS, TCS, and FLO.
- BCC's SEC filings can be seen here. And to visit BOISE CASCADE Co's official web site, go to www.bc.com.
BCC Valuation Summary
- BCC's price/earnings ratio is 3.9; this is 80.4% lower than that of the median Basic Materials stock.
- Over the past 104 months, BCC's price/sales ratio has gone down 0.1.
- BCC's EV/EBIT ratio has moved down 18.9 over the prior 104 months.
Below are key valuation metrics over time for BCC.
Stock | Date | P/S | P/B | P/E | EV/EBIT |
---|---|---|---|---|---|
BCC | 2021-09-03 | 0.3 | 1.9 | 3.9 | 2.5 |
BCC | 2021-09-02 | 0.3 | 1.9 | 3.9 | 2.5 |
BCC | 2021-09-01 | 0.3 | 1.9 | 3.9 | 2.5 |
BCC | 2021-08-31 | 0.3 | 1.9 | 3.9 | 2.5 |
BCC | 2021-08-30 | 0.3 | 1.9 | 4.0 | 2.6 |
BCC | 2021-08-27 | 0.3 | 1.9 | 4.0 | 2.6 |
BCC Growth Metrics
- Its 2 year net cashflow from operations growth rate is now at 40.52%.
- The 4 year revenue growth rate now stands at 28.82%.
- The year over year price growth rate now stands at 128.81%.

The table below shows BCC's growth in key financial areas (numbers in millions of US dollars).
Date | Revenue | Operating Cash Flow | Net Income to Common Stock |
---|---|---|---|
2021-12-31 | 7,926.111 | 666.984 | 712.486 |
2021-09-30 | 7,616.159 | 527.836 | 569.412 |
2021-06-30 | 7,326.021 | 467.419 | 580.905 |
2021-03-31 | 6,125.62 | 409.234 | 311.935 |
2020-12-31 | 5,474.838 | 294.516 | 174.979 |
2020-09-30 | 5,104.32 | 344.668 | 163.625 |
BCC's Quality Factors
The “Quality” component of the POWR Ratings focuses on 31 different factors of a companies fundamentals and operational strength. Here are some key insights as we drill into the specifics of these quality attributes.- BCC has a Quality Grade of B, ranking ahead of 82.64% of graded US stocks.
- BCC's asset turnover comes in at 3.274 -- ranking 13th of 105 Wholesale stocks.
- ABC, HBP, and RELL are the stocks whose asset turnover ratios are most correlated with BCC.
The table below shows BCC's key quality metrics over time.
Period | Asset Turnover | Gross Margin | ROIC |
---|---|---|---|
2021-06-30 | 3.274 | 0.207 | 0.571 |
2021-03-31 | 3.008 | 0.185 | 0.339 |
2020-12-31 | 2.873 | 0.171 | 0.215 |
2020-09-30 | 2.778 | 0.169 | 0.169 |
2020-06-30 | 2.705 | 0.152 | 0.097 |
2020-03-31 | 2.740 | 0.149 | 0.090 |
BCC Price Target
For more insight on analysts targets of BCC, see our BCC price target page. And for a list of of all stocks sorted by upside potential based on analyst target price, see our Top Price Target page.
Average Price Target | $63.80 | Average Broker Recommendation | 2.1 (Hold) |
BCC Stock Price Chart Interactive Chart >
BCC Price/Volume Stats
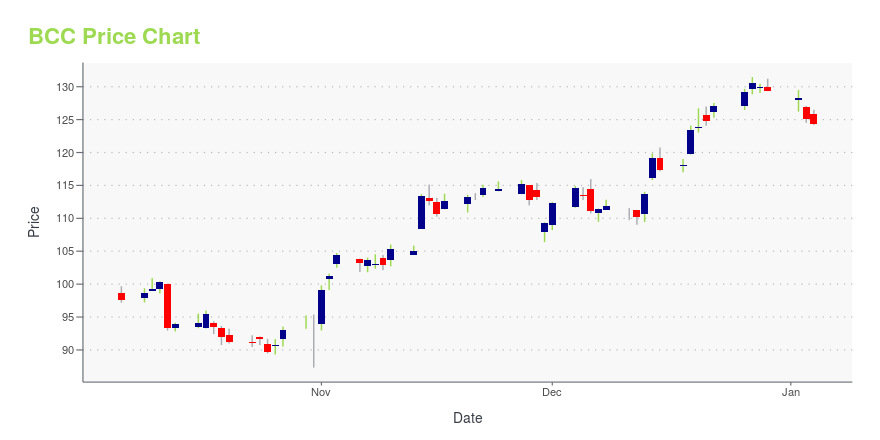
Current price | $59.49 | 52-week high | $85.17 |
Prev. close | $58.90 | 52-week low | $46.51 |
Day low | $57.02 | Volume | 377,600 |
Day high | $60.50 | Avg. volume | 431,872 |
50-day MA | $74.58 | Dividend yield | 0.81% |
200-day MA | $70.11 | Market Cap | 2.35B |
Boise Cascade, L.L.C. (BCC) Company Bio
Boise Cascade manufactures wood products and distributes building materials in the United States and Canada. Its Wood Products segment manufactures plywood, EWP, studs, particleboard and ponderosa pine lumber. Its Building Materials Distribution segment is a wholesale distributor of various building materials, including EWP, OSB, plywood, lumber and general line items, such as siding, metal products, insulation, roofing and composite decking. The company was founded in 2004 and is based in Boise, Idaho.
Latest BCC News From Around the Web
Below are the latest news stories about BOISE CASCADE Co that investors may wish to consider to help them evaluate BCC as an investment opportunity.
Boise Cascade Company 2021 Q4 - Results - Earnings Call PresentationThe following slide deck was published by Boise Cascade Company in conjunction with their 2021 Q4 earnings call.... |
Boise Cascade's (BCC) CEO Nate Jorgensen on Q4 2021 Results - Earnings Call TranscriptBoise Cascade Company (BCC) Q4 2021 Earnings Conference Call February 23, 2022 11:00 AM ET Company Participants Kelly Hibbs – Senior Vice President, Chief Financial Officer and Treasurer Nate Jorgensen – Chief Executive Officer Mike Brown – Head-Wood Products Operations Jeff Strom – Head-Building Materials Distribution Conference Call Participants Mark... |
Lowe's Hikes 2022 Outlook But Boise Cascade Joins Home Depot Stock's PlungeHome improvement chains, lumber suppliers all beat views. But Home Depot stock and its peers are selling amid warnings of pricing volatility, business uncertainties. |
Boise Cascade Company Reports Fourth Quarter and Full Year 2021 ResultsBOISE, Idaho, February 22, 2022--Boise Cascade Company ("Boise Cascade," the "Company," "we," or "our") (NYSE: BCC) today reported fourth quarter net income of $169.1 million, or $4.26 per share, on sales of $1.8 billion. For the full year 2021, Boise Cascade reported net income of $712.5 million, or $17.97 per share, on sales of $7.9 billion. For 2020 comparative results, see the table below, as well as 'Other Items Impacting 2020 Results.' |
Is Boise Cascade (BCC) Stock Outpacing Its Construction Peers This Year?Here is how Boise Cascade (BCC) and Sterling Construction (STRL) have performed compared to their sector so far this year. |
BCC Price Returns
1-mo | -24.29% |
3-mo | -13.01% |
6-mo | -13.58% |
1-year | 13.90% |
3-year | 154.14% |
5-year | 147.53% |
YTD | -13.58% |
2021 | 62.14% |
2020 | 37.01% |
2019 | 59.08% |
2018 | -38.36% |
2017 | 77.67% |
BCC Dividends
Ex-Dividend Date | Type | Payout Amount | Change | ||||||
---|---|---|---|---|---|---|---|---|---|
Loading, please wait... |
Continue Researching BCC
Want to see what other sources are saying about BOISE CASCADE Co's financials and stock price? Try the links below:BOISE CASCADE Co (BCC) Stock Price | Nasdaq
BOISE CASCADE Co (BCC) Stock Quote, History and News - Yahoo Finance
BOISE CASCADE Co (BCC) Stock Price and Basic Information | MarketWatch
Loading social stream, please wait...