
Brinks Company (The) (BCO): Price and Financial Metrics
BCO Price/Volume Stats
| Current price | $108.86 | 52-week high | $109.48 |
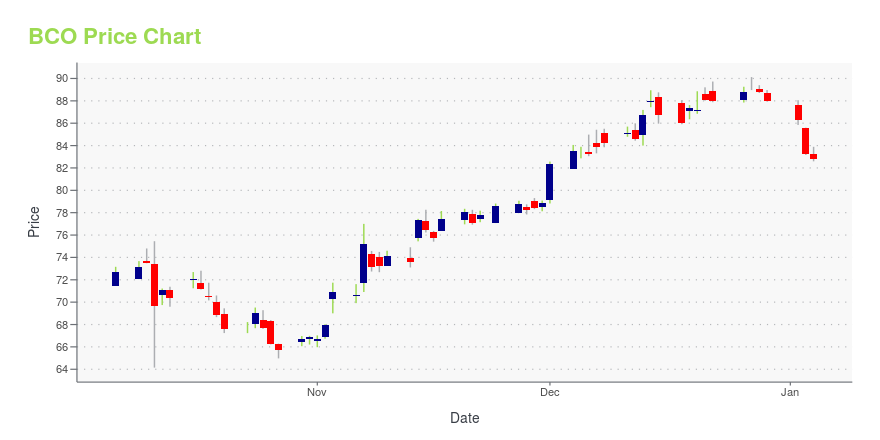
| Prev. close | $106.83 | 52-week low | $64.15 |
| Day low | $107.15 | Volume | 321,805 |
| Day high | $109.41 | Avg. volume | 237,031 |
| 50-day MA | $102.43 | Dividend yield | 0.89% |
| 200-day MA | $87.35 | Market Cap | 4.84B |
BCO Stock Price Chart Interactive Chart >
Brinks Company (The) (BCO) Company Bio
Brink's Company is a leading provider of secure transportation and cash management services, as well as security-related services worldwide. The Brink's Company was founded in 1838 and is based in Richmond, Virginia.
Latest BCO News From Around the Web
Below are the latest news stories about BRINKS CO that investors may wish to consider to help them evaluate BCO as an investment opportunity.
The Brink's Company's (NYSE:BCO) Business Is Yet to Catch Up With Its Share PriceWhen close to half the companies in the United States have price-to-earnings ratios (or "P/E's") below 16x, you may... |
Is Brink's (BCO) Outperforming Other Business Services Stocks This Year?Here is how Brink's (BCO) and Broadridge Financial Solutions (BR) have performed compared to their sector so far this year. |
Record Q2 Revenue and Operating Profit Pushed Brink’s Company (BCO) in Q3Ariel Investments, an investment management company, released its “Ariel Small Cap Value Strategy” third-quarter 2023 investor letter. A copy of the same can be downloaded here. The Ariel Small Cap Value Tax-Exempt Composite declined -7.53% gross of fees (-7.76% net of fees) in the quarter underperforming both the Russell 2000 Value Index and the Russell 2000 […] |
Barrett Business Services, Inc. (BBSI) Hits Fresh High: Is There Still Room to Run?Barrett (BBSI) is at a 52-week high, but can investors hope for more gains in the future? We take a look at the company's fundamentals for clues. |
Are Business Services Stocks Lagging Brink's (BCO) This Year?Here is how Brink's (BCO) and Broadridge Financial Solutions (BR) have performed compared to their sector so far this year. |
BCO Price Returns
| 1-mo | 5.92% |
| 3-mo | 23.00% |
| 6-mo | 32.56% |
| 1-year | 55.21% |
| 3-year | 51.78% |
| 5-year | 24.11% |
| YTD | 24.42% |
| 2023 | 65.85% |
| 2022 | -16.98% |
| 2021 | -8.00% |
| 2020 | -19.55% |
| 2019 | 41.29% |
BCO Dividends
| Ex-Dividend Date | Type | Payout Amount | Change | ||||||
|---|---|---|---|---|---|---|---|---|---|
| Loading, please wait... | |||||||||
Continue Researching BCO
Want to see what other sources are saying about Brinks Co's financials and stock price? Try the links below:Brinks Co (BCO) Stock Price | Nasdaq
Brinks Co (BCO) Stock Quote, History and News - Yahoo Finance
Brinks Co (BCO) Stock Price and Basic Information | MarketWatch
Loading social stream, please wait...