
Blucora, Inc. (BCOR): Price and Financial Metrics
BCOR Price/Volume Stats
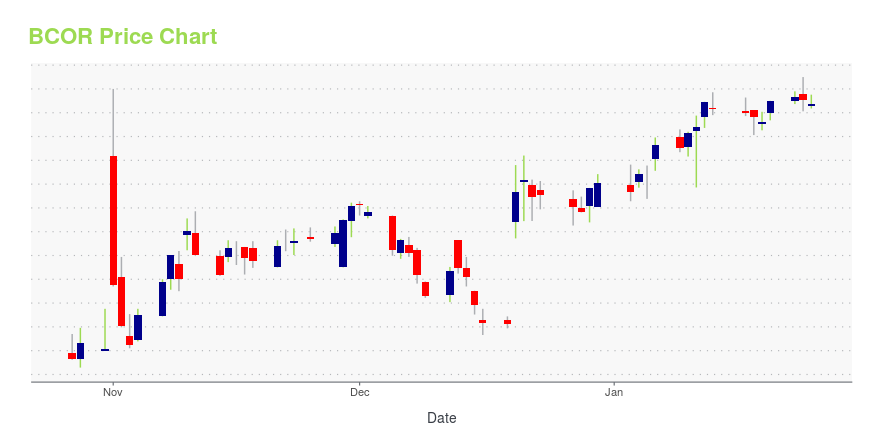
| Current price | $27.19 | 52-week high | $27.75 |
| Prev. close | $27.27 | 52-week low | $15.10 |
| Day low | $27.09 | Volume | 262,400 |
| Day high | $27.38 | Avg. volume | 313,650 |
| 50-day MA | $25.05 | Dividend yield | N/A |
| 200-day MA | $20.94 | Market Cap | 1.31B |
BCOR Stock Price Chart Interactive Chart >
Blucora, Inc. (BCOR) Company Bio
Bluecora operates a portfolio of Internet businesses in the Unites States and internationally. It operates through three segments: Search and Content, Tax Preparation, and E-Commerce. The company was founded in 1996 and is based in Bellevue, Washington.
Latest BCOR News From Around the Web
Below are the latest news stories about BLUCORA INC that investors may wish to consider to help them evaluate BCOR as an investment opportunity.
Blucora Announces New Corporate Name and Ticker SymbolBlucora to Change Name to Avantax and Ticker Symbol to AVTADALLAS, Jan. 25, 2023 (GLOBE NEWSWIRE) -- Blucora, Inc. (NASDAQ: BCOR), a leading provider of tax-focused wealth management services, today announced a corporate name change to Avantax, Inc. and a change of its NASDAQ ticker symbol from “BCOR” to “AVTA” effective as of 12:01 a.m. Eastern Time on Thursday, January 26, 2023 (the “Effective Date”). Despite this name change, the CUSIP number (095229100) remains unchanged. On the Effective Da |
Blucora Enters into $270 Million Amended and Restated Credit FacilityDALLAS, Jan. 24, 2023 (GLOBE NEWSWIRE) -- Blucora, Inc. (“Blucora” or the “Company”) (NASDAQ: BCOR) announced today that the Company and certain of its wholly-owned subsidiaries entered into a credit agreement (the “Amended and Restated Credit Agreement”), which amended and restated the Company’s existing credit agreement, dated May 22, 2017, as amended. The Amended and Restated Credit Agreement provides for a delayed draw term loan facility of up to a maximum principal amount of $270 million an |
Blucora Acknowledges Director Nomination Notice from Engine CapitalCompany Has Successfully Unlocked Significant Value for Stockholders Through Sale of TaxAct and is Now a Pure-Play Wealth Management Company Company Confirms Previously Announced Plans to Return Significant Capital to Stockholders and Rebrand DALLAS, Jan. 23, 2023 (GLOBE NEWSWIRE) -- Blucora, Inc. (“Blucora” or the “Company”) (NASDAQ: BCOR) today disclosed that on January 20, 2023, Engine Capital LP (together with its affiliates, “Engine”) provided notice of nomination of a candidate for electio |
These 2 Under-the-Radar Stocks Have Incredibly Bright FuturesAlthough the Nasdaq Composite was down 33% in 2022 and the S&P 500 dropped about 19% last year, not all stocks were in negative territory. In fact, these two stocks -- both of them financial stocks -- not only beat the market, but blew it out of the water. Here's why these two under-the-radar stocks also have bright futures. |
Why Blucora Stock Surged 10.6% Higher This WeekBlucora Inc. (NASDAQ: BCOR) saw its stock price surge higher this week, up 10.6% from last Friday's close through 11:15 a.m. EST on Friday, according to S&P Global Market Intelligence. The financial stock has been one of the best performers in the sector this year, up about 44% year-to-date (YTD), trading at around $25 per share. In an otherwise flat week, Blucora had a good week as the Dow Jones Industrial Average was up just 0.4%, but both the S&P 500 (-0.8%) and the Nasdaq Composite (- 2.6%) were down as of 11:15 a.m. EST Friday. |
BCOR Price Returns
| 1-mo | N/A |
| 3-mo | N/A |
| 6-mo | N/A |
| 1-year | N/A |
| 3-year | 63.89% |
| 5-year | -10.00% |
| YTD | N/A |
| 2023 | 0.00% |
| 2022 | 47.40% |
| 2021 | 8.86% |
| 2020 | -39.14% |
| 2019 | -1.88% |
Continue Researching BCOR
Want to see what other sources are saying about Blucora Inc's financials and stock price? Try the links below:Blucora Inc (BCOR) Stock Price | Nasdaq
Blucora Inc (BCOR) Stock Quote, History and News - Yahoo Finance
Blucora Inc (BCOR) Stock Price and Basic Information | MarketWatch
Loading social stream, please wait...