Belden Inc. (BDC): Price and Financial Metrics
GET POWR RATINGS... FREE!
BDC POWR Grades
- Value is the dimension where BDC ranks best; there it ranks ahead of 89.29% of US stocks.
- BDC's strongest trending metric is Growth; it's been moving down over the last 177 days.
- BDC ranks lowest in Stability; there it ranks in the 53rd percentile.
BDC Stock Summary
- With a year-over-year growth in debt of -20.09%, BELDEN INC's debt growth rate surpasses merely 14.51% of about US stocks.
- Over the past twelve months, BDC has reported earnings growth of 129.12%, putting it ahead of 89.04% of US stocks in our set.
- Shareholder yield, a measure of how much is returned to shareholders via dividends and share repurchases, for BDC comes in at 10.75% -- higher than that of 83.59% of stocks in our set.
- Stocks with similar financial metrics, market capitalization, and price volatility to BELDEN INC are MMSI, MIND, BODY, LFUS, and BIOL.
- BDC's SEC filings can be seen here. And to visit BELDEN INC's official web site, go to www.belden.com.
BDC Valuation Summary
- BDC's price/earnings ratio is 13.8; this is 27.75% lower than that of the median Industrials stock.
- Over the past 243 months, BDC's price/sales ratio has gone up 0.7.
Below are key valuation metrics over time for BDC.
Stock | Date | P/S | P/B | P/E | EV/EBIT |
---|---|---|---|---|---|
BDC | 2023-03-17 | 1.3 | 3.1 | 13.8 | 11.6 |
BDC | 2023-03-16 | 1.4 | 3.1 | 14.1 | 11.8 |
BDC | 2023-03-15 | 1.3 | 3.0 | 13.7 | 11.5 |
BDC | 2023-03-14 | 1.4 | 3.2 | 14.3 | 12.0 |
BDC | 2023-03-13 | 1.4 | 3.1 | 13.8 | 11.7 |
BDC | 2023-03-10 | 1.4 | 3.1 | 14.1 | 11.8 |
BDC Growth Metrics
- The 2 year net income to common stockholders growth rate now stands at 116.8%.
- Its 3 year net income to common stockholders growth rate is now at -52.14%.
- The 3 year revenue growth rate now stands at -3.31%.

The table below shows BDC's growth in key financial areas (numbers in millions of US dollars).
Date | Revenue | Operating Cash Flow | Net Income to Common Stock |
---|---|---|---|
2022-12-31 | 2,606.485 | 281.296 | 254.663 |
2022-09-30 | 2,586.323 | 248.936 | 142.927 |
2022-06-30 | 2,546.667 | 236.82 | 85.897 |
2022-03-31 | 2,482.09 | 255.595 | 71.1 |
2021-12-31 | 2,408.1 | 272.055 | 63.925 |
2021-09-30 | 2,267.73 | 236.594 | 120.63 |
BDC's Quality Factors
The “Quality” component of the POWR Ratings focuses on 31 different factors of a companies fundamentals and operational strength. Here are some key insights as we drill into the specifics of these quality attributes.- BDC has a Quality Grade of C, ranking ahead of 64.46% of graded US stocks.
- BDC's asset turnover comes in at 0.671 -- ranking 30th of 40 Steel Works Etc stocks.
- X, STLD, and KALU are the stocks whose asset turnover ratios are most correlated with BDC.
The table below shows BDC's key quality metrics over time.
Period | Asset Turnover | Gross Margin | ROIC |
---|---|---|---|
2021-07-04 | 0.671 | 0.353 | 0.083 |
2021-04-04 | 0.619 | 0.353 | 0.028 |
2020-12-31 | 0.595 | 0.356 | 0.007 |
2020-09-27 | 0.516 | 0.352 | -0.054 |
2020-06-28 | 0.544 | 0.361 | -0.192 |
2020-03-29 | 0.580 | 0.368 | -0.141 |
BDC Price Target
For more insight on analysts targets of BDC, see our BDC price target page. And for a list of of all stocks sorted by upside potential based on analyst target price, see our Top Price Target page.
Average Price Target | $67.17 | Average Broker Recommendation | 1.57 (Moderate Buy) |
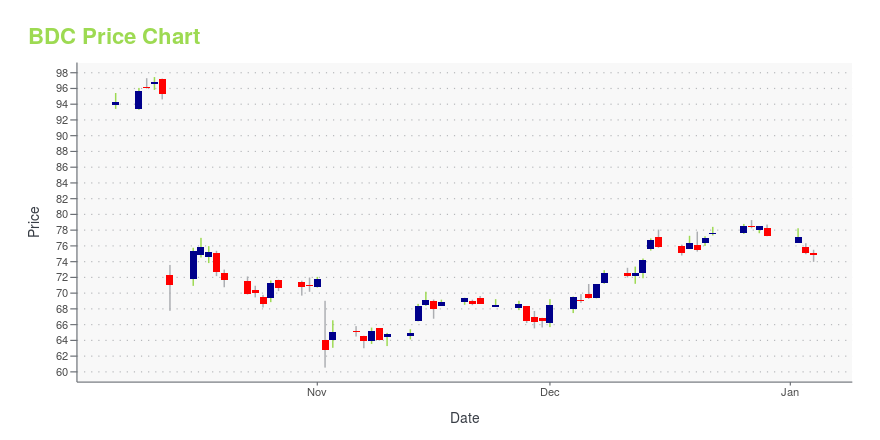
BDC Stock Price Chart Interactive Chart >
BDC Price/Volume Stats
Current price | $83.89 | 52-week high | $92.33 |
Prev. close | $84.28 | 52-week low | $47.89 |
Day low | $83.10 | Volume | 159,800 |
Day high | $84.25 | Avg. volume | 283,175 |
50-day MA | $83.93 | Dividend yield | 0.24% |
200-day MA | $71.31 | Market Cap | 3.60B |
Belden Inc. (BDC) Company Bio
Belden, Inc. engages in the provision of innovative signal transmission solutions. It operates through the Enterprise Solutions and Industrial Solutions segments. The Enterprise Solutions segment offers network infrastructure solutions, as well as cabling and connectivity solutions for broadcast, commercial audio/video, and security applications. The Industrial Solutions segment includes physical network and fieldbus infrastructure components and on-machine connectivity systems customized to end user, and original equipment manufacturer (OEM) needs. The company was founded by Joseph C. Belden in 1902 and is headquartered in St. Louis, MO.
Latest BDC News From Around the Web
Below are the latest news stories about BELDEN INC that investors may wish to consider to help them evaluate BDC as an investment opportunity.
Belden Joins Responsible Business Alliance to Support Environmental, Social and Governance (ESG) GoalsST. LOUIS, March 21, 2023--Belden Inc. (NYSE: BDC), a leading global supplier of network infrastructure solutions, has announced that the company has joined the Responsible Business Alliance ("RBA") as an affiliate member. In this capacity, Belden demonstrates the company’s commitment to progressively align operations with the RBA Code of Conduct. The RBA seeks to improve global supply chains by supporting and encouraging member companies and their suppliers to improve working and operational co |
Is Belden (BDC) Stock Outpacing Its Industrial Products Peers This Year?Here is how Belden (BDC) and W.W. Grainger (GWW) have performed compared to their sector so far this year. |
Belden Releases First UL-Certified Hybrid Cable for Fault-Managed Power Class 4 Circuits in Smart BuildingsST. LOUIS, March 17, 2023--Belden, a leading global supplier of network infrastructure and digitization solutions, is proud to announce its Fault-Managed Power System (FMPS) Hybrid Cables, which are designed and certified for Class 4 circuits. |
Valmont (VMI) Raises Dividend, Reauthorizes Share RepurchaseValmont (VMI) increases quarterly dividend and reauthorizes its share repurchase program worth $400 million. |
Valmont's (VMI) Q4 Earnings Miss, Sales Beat EstimatesValmont's (VMI) Q4 performance reflects strong pricing and demand for its products & services across various key markets. |
BDC Price Returns
1-mo | -0.04% |
3-mo | 17.10% |
6-mo | 39.25% |
1-year | 50.84% |
3-year | 141.43% |
5-year | 24.06% |
YTD | 16.75% |
2022 | 9.75% |
2021 | 57.46% |
2020 | -23.40% |
2019 | 32.14% |
2018 | -45.70% |
BDC Dividends
Ex-Dividend Date | Type | Payout Amount | Change | ||||||
---|---|---|---|---|---|---|---|---|---|
Loading, please wait... |
Continue Researching BDC
Want to see what other sources are saying about Belden Inc's financials and stock price? Try the links below:Belden Inc (BDC) Stock Price | Nasdaq
Belden Inc (BDC) Stock Quote, History and News - Yahoo Finance
Belden Inc (BDC) Stock Price and Basic Information | MarketWatch
Loading social stream, please wait...