Bloom Energy Corporation (BE): Price and Financial Metrics
BE Price/Volume Stats
Current price | $13.23 | 52-week high | $26.55 |
Prev. close | $13.42 | 52-week low | $12.33 |
Day low | $13.07 | Volume | 2,699,723 |
Day high | $13.58 | Avg. volume | 3,491,175 |
50-day MA | $15.34 | Dividend yield | N/A |
200-day MA | $18.09 | Market Cap | 2.77B |
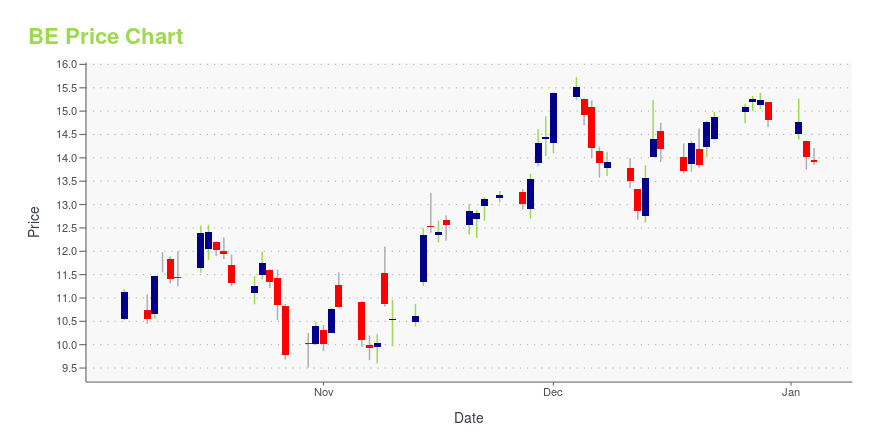
BE Stock Price Chart Interactive Chart >
BE POWR Grades
- BE scores best on the Growth dimension, with a Growth rank ahead of 86.5% of US stocks.
- The strongest trend for BE is in Growth, which has been heading up over the past 177 days.
- BE ranks lowest in Sentiment; there it ranks in the 2nd percentile.
BE Stock Summary
- BLOOM ENERGY CORP's capital turnover -- a measure of revenue relative to shareholder's equity -- is better than 88.81% of US listed stocks.
- Equity multiplier, or assets relative to shareholders' equity, comes in at 7.18 for BLOOM ENERGY CORP; that's greater than it is for 84.12% of US stocks.
- BLOOM ENERGY CORP's shareholder yield -- a measure of how much capital is returned to stockholders via dividends and buybacks -- is -27.24%, greater than the shareholder yield of just 15.93% of stocks in our set.
- Stocks with similar financial metrics, market capitalization, and price volatility to BLOOM ENERGY CORP are ASAN, MODN, PL, QLYS, and LIDR.
- Visit BE's SEC page to see the company's official filings. To visit the company's web site, go to www.bloomenergy.com.
BE Valuation Summary
- In comparison to the median Industrials stock, BE's price/sales ratio is 91.67% higher, now standing at 2.3.
- BE's price/sales ratio has moved down 2.6 over the prior 63 months.
Below are key valuation metrics over time for BE.
Stock | Date | P/S | P/B | P/E | EV/EBIT |
---|---|---|---|---|---|
BE | 2023-09-19 | 2.3 | 10.0 | -12.7 | -19.6 |
BE | 2023-09-18 | 2.3 | 9.8 | -12.5 | -19.4 |
BE | 2023-09-15 | 2.4 | 10.3 | -13.1 | -20.1 |
BE | 2023-09-14 | 2.4 | 10.6 | -13.5 | -20.6 |
BE | 2023-09-13 | 2.4 | 10.2 | -13.0 | -20.0 |
BE | 2023-09-12 | 2.4 | 10.5 | -13.3 | -20.4 |
BE's Quality Factors
The “Quality” component of the POWR Ratings focuses on 31 different factors of a companies fundamentals and operational strength. Here are some key insights as we drill into the specifics of these quality attributes.- BE has a Quality Grade of D, ranking ahead of 22.78% of graded US stocks.
- BE's asset turnover comes in at 0.597 -- ranking 25th of 53 Electrical Equipment stocks.
- 500 - Internal server error
The table below shows BE's key quality metrics over time.
Period | Asset Turnover | Gross Margin | ROIC |
---|---|---|---|
2021-06-30 | 0.597 | 0.243 | -0.026 |
2021-03-31 | 0.588 | 0.241 | -0.019 |
2020-12-31 | 0.576 | 0.209 | -0.043 |
2020-09-30 | 0.492 | 0.134 | -0.087 |
2020-06-30 | 0.547 | 0.124 | -0.108 |
2020-06-30 | 0.547 | 0.124 | -0.108 |
BE Price Target
For more insight on analysts targets of BE, see our BE price target page. And for a list of of all stocks sorted by upside potential based on analyst target price, see our Top Price Target page.
Average Price Target | $32.14 | Average Broker Recommendation | 1.76 (Moderate Buy) |
Bloom Energy Corporation (BE) Company Bio
Bloom Energy Corporation designs, manufactures, and sells solid-oxide fuel cell systems. It offers Bloom Energy Server, a stationary power generation platform that converts standard low-pressure natural gas or biogas into electricity through an electrochemical process without combustion. The company was formerly known as Ion America Corp. and changed its name to Bloom Energy Corporation in September 2006. The company was founded in 2001 and is based in Sunnyvale, California.
Latest BE News From Around the Web
Below are the latest news stories about BLOOM ENERGY CORP that investors may wish to consider to help them evaluate BE as an investment opportunity.
Bloom Energy Stands Out Among Renewable Energy StocksBE stock is set to continue producing over the long term. |
These 2 Dividend Stocks Are Investing in This Niche Industry. Should You Do the Same?Market veterans will likely recall that hydrogen fuel cell stocks like Plug Power and Ballard Power Systems were all the rage at one time. This alternative energy was going to change the world, after all. As it turns out, the world wasn't quite ready for fuel cells; the business wasn't quite ready for the world, either. |
The 3 Most Undervalued Hydrogen Stocks to Buy in September 2023Gear up for the transition to cleaner sources of energy with these three highly undervalued hydrogen stocks. |
Bloom Energy Corporation (NYSE:BE) is largely controlled by institutional shareholders who own 79% of the companyKey Insights Significantly high institutional ownership implies Bloom Energy's stock price is sensitive to their... |
The 3 Best Hydrogen Stocks to Buy Now: September 2023These are the best hydrogen stocks to buy and hold as they represent companies making big investments for growth in the hydrogen economy. |
BE Price Returns
1-mo | -14.37% |
3-mo | -19.08% |
6-mo | -33.62% |
1-year | -38.89% |
3-year | -21.62% |
5-year | -61.18% |
YTD | -30.81% |
2022 | -12.81% |
2021 | -23.48% |
2020 | 283.67% |
2019 | -25.15% |
2018 | N/A |
Continue Researching BE
Here are a few links from around the web to help you further your research on Bloom Energy Corp's stock as an investment opportunity:Bloom Energy Corp (BE) Stock Price | Nasdaq
Bloom Energy Corp (BE) Stock Quote, History and News - Yahoo Finance
Bloom Energy Corp (BE) Stock Price and Basic Information | MarketWatch
Loading social stream, please wait...