Beam Therapeutics Inc. (BEAM): Price and Financial Metrics
GET POWR RATINGS... FREE!
BEAM POWR Grades
- Quality is the dimension where BEAM ranks best; there it ranks ahead of 35.34% of US stocks.
- BEAM's strongest trending metric is Stability; it's been moving up over the last 179 days.
- BEAM's current lowest rank is in the Stability metric (where it is better than 2.53% of US stocks).
BEAM Stock Summary
- Of note is the ratio of BEAM THERAPEUTICS INC's sales and general administrative expense to its total operating expenses; only 8.51% of US stocks have a lower such ratio.
- BEAM's price/sales ratio is 34.06; that's higher than the P/S ratio of 95.47% of US stocks.
- Revenue growth over the past 12 months for BEAM THERAPEUTICS INC comes in at 11,673.62%, a number that bests 99.76% of the US stocks we're tracking.
- Stocks with similar financial metrics, market capitalization, and price volatility to BEAM THERAPEUTICS INC are RPTX, LYRA, KROS, INMB, and VACC.
- BEAM's SEC filings can be seen here. And to visit BEAM THERAPEUTICS INC's official web site, go to www.beamtx.com.
BEAM Valuation Summary
- BEAM's price/sales ratio is 34.1; this is 1563.41% higher than that of the median Healthcare stock.
- BEAM's price/earnings ratio has moved down 2.8 over the prior 36 months.
Below are key valuation metrics over time for BEAM.
Stock | Date | P/S | P/B | P/E | EV/EBIT |
---|---|---|---|---|---|
BEAM | 2023-01-20 | 34.1 | 4.4 | -10.0 | -10.1 |
BEAM | 2023-01-19 | 32.5 | 4.2 | -9.5 | -9.6 |
BEAM | 2023-01-18 | 34.1 | 4.4 | -9.9 | -10.0 |
BEAM | 2023-01-17 | 34.1 | 4.4 | -9.9 | -10.0 |
BEAM | 2023-01-13 | 33.1 | 4.3 | -9.7 | -9.8 |
BEAM | 2023-01-12 | 33.2 | 4.3 | -9.7 | -9.8 |
BEAM's Quality Factors
The “Quality” component of the POWR Ratings focuses on 31 different factors of a companies fundamentals and operational strength. Here are some key insights as we drill into the specifics of these quality attributes.- BEAM has a Quality Grade of D, ranking ahead of 6.52% of graded US stocks.
- BEAM's asset turnover comes in at 0 -- ranking 441st of 682 Pharmaceutical Products stocks.
- 500 - Internal server error
The table below shows BEAM's key quality metrics over time.
Period | Asset Turnover | Gross Margin | ROIC |
---|---|---|---|
2021-06-30 | 0 | 1 | -0.966 |
2021-03-31 | 0 | 1 | -1.254 |
2020-12-31 | 0 | 1 | -1.054 |
2020-09-30 | 0 | 1 | -0.896 |
2019-12-31 | 0 | 1 | -1.360 |
BEAM Price Target
For more insight on analysts targets of BEAM, see our BEAM price target page. And for a list of of all stocks sorted by upside potential based on analyst target price, see our Top Price Target page.
Average Price Target | $123.57 | Average Broker Recommendation | 1.36 (Strong Buy) |
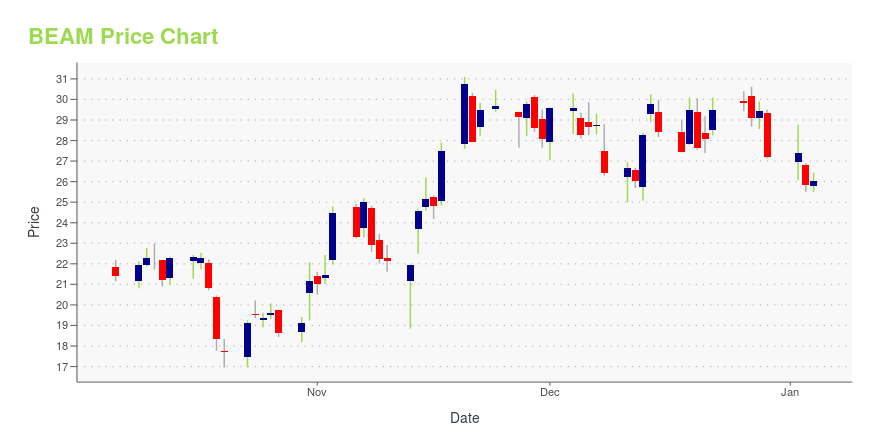
BEAM Stock Price Chart Interactive Chart >
BEAM Price/Volume Stats
Current price | $43.85 | 52-week high | $80.00 |
Prev. close | $44.44 | 52-week low | $27.77 |
Day low | $42.89 | Volume | 444,263 |
Day high | $45.48 | Avg. volume | 776,353 |
50-day MA | $43.29 | Dividend yield | N/A |
200-day MA | $46.59 | Market Cap | 3.09B |
Beam Therapeutics Inc. (BEAM) Company Bio
Beam Therapeutics Inc., a biotechnology company, engages in developing precision genetic medicines for patients suffering from serious diseases in the United States. The company is developing therapies for the development of sickle cell disease and beta-thalassemia; CAR-T cell therapies for pediatric T-cell acute lymphoblastic leukemia and pediatric acute myeloid leukemia; therapies for alpha-1 antitrypsin deficiency and glycogen storage disorder 1A; and therapies for ocular and central nervous system disorders. It has a research and clinical collaboration agreement with Magenta Therapeutics, Inc. Beam Therapeutics Inc. was founded in 2017 and is based in Cambridge, Massachusetts.
Latest BEAM News From Around the Web
Below are the latest news stories about BEAM THERAPEUTICS INC that investors may wish to consider to help them evaluate BEAM as an investment opportunity.
A New Bull Market Is Coming: 3 Stocks That Could SkyrocketIs the stock market in store for another bull market? Absolutely, undoubtedly yes. Will it take place in 2023? That remains to be seen. But there's no question that sooner or later stocks will once again begin a sustained period of positive momentum. |
3 Stocks That Could Create Lasting Generational WealthCountry music singer Garth Brooks once said that he had more money than his great-grandchildren would be able to spend. Here are three stocks that could create lasting generational wealth. If you haven't heard of base editing, just give it some time. |
Beam Therapeutics Reports Progress Across Base Editing Portfolio and Outlines Key Anticipated MilestonesBEACON Trial of BEAM-101 in Sickle Cell Disease Ongoing with Data from Multiple Patients Expected in 2024; Expansion Phase Initiation Expected in 2023 First Patient Dosing in BEAM-201 Trial in Patients with T-ALL/T-LL Expected by Mid-2023 Regulatory Submissions Planned for BEAM-301 by Late 2023/Early 2024 and BEAM-302 in Early 2024 North Carolina Manufacturing Facility Expected to Initiate GMP Operations in Late 2023 Approximately $1 Billion Estimated Cash, Cash Equivalents and Marketable Securi |
Beam Therapeutics to Present at the 41st Annual J.P. Morgan Healthcare ConferenceCAMBRIDGE, Mass., Jan. 03, 2023 (GLOBE NEWSWIRE) -- Beam Therapeutics Inc. (Nasdaq: BEAM), a biotechnology company developing precision genetic medicines through base editing, today announced that management will present at the 41st Annual J.P. Morgan Healthcare Conference on Monday, Jan. 9, 2023 at 11:15 a.m. PT in San Francisco. The live webcast will be available in the investor section of the company's website at www.beamtx.com. The webcast will be archived for 60 days following the presentat |
Cathie Wood Is Loading Up On These 12 StocksIn this piece, we will take a look at the top twelve stocks that are on Cathie Wood’s radar. For more stocks, head on over to Cathie Wood Is Loading Up On These 5 Stocks. If there’s one thing that can be said for certain in today’s highly volatile environment, it’s that 2022 has not […] |
BEAM Price Returns
1-mo | 15.15% |
3-mo | -10.03% |
6-mo | -30.37% |
1-year | -32.51% |
3-year | N/A |
5-year | N/A |
YTD | 12.12% |
2022 | -50.92% |
2021 | -2.39% |
2020 | N/A |
2019 | N/A |
2018 | N/A |
Loading social stream, please wait...