Bunge Ltd. (BG): Price and Financial Metrics
GET POWR RATINGS... FREE!
BG POWR Grades
- Growth is the dimension where BG ranks best; there it ranks ahead of 77.23% of US stocks.
- BG's strongest trending metric is Momentum; it's been moving down over the last 179 days.
- BG's current lowest rank is in the Momentum metric (where it is better than 0.76% of US stocks).
BG Stock Summary
- Bunge LTD's capital turnover -- a measure of revenue relative to shareholder's equity -- is better than 95.79% of US listed stocks.
- Of note is the ratio of Bunge LTD's sales and general administrative expense to its total operating expenses; 85.61% of US stocks have a lower such ratio.
- With a price/sales ratio of 0.26, Bunge LTD has a higher such ratio than merely 4.17% of stocks in our set.
- If you're looking for stocks that are quantitatively similar to Bunge LTD, a group of peers worth examining would be PKG, SMG, SNX, DAR, and WRK.
- Visit BG's SEC page to see the company's official filings. To visit the company's web site, go to www.bunge.com.
BG Valuation Summary
- BG's price/earnings ratio is 5.5; this is 75.72% lower than that of the median Consumer Defensive stock.
- BG's price/sales ratio has moved down 0 over the prior 240 months.
- Over the past 240 months, BG's EV/EBIT ratio has gone down 1.4.
Below are key valuation metrics over time for BG.
Stock | Date | P/S | P/B | P/E | EV/EBIT |
---|---|---|---|---|---|
BG | 2021-09-03 | 0.2 | 1.5 | 5.5 | 7.0 |
BG | 2021-09-02 | 0.2 | 1.5 | 5.5 | 7.0 |
BG | 2021-09-01 | 0.2 | 1.5 | 5.4 | 6.9 |
BG | 2021-08-31 | 0.2 | 1.5 | 5.4 | 6.9 |
BG | 2021-08-30 | 0.2 | 1.5 | 5.4 | 6.9 |
BG | 2021-08-27 | 0.2 | 1.5 | 5.5 | 7.0 |
BG Growth Metrics
- Its 5 year revenue growth rate is now at -2.86%.
- Its 2 year net income to common stockholders growth rate is now at -2800%.
- The year over year net cashflow from operations growth rate now stands at -383.31%.

The table below shows BG's growth in key financial areas (numbers in millions of US dollars).
Date | Revenue | Operating Cash Flow | Net Income to Common Stock |
---|---|---|---|
2021-12-31 | 59,152 | -2,894 | 2,044 |
2021-09-30 | 55,079 | -3,050 | 2,371 |
2021-06-30 | 51,121 | -3,470 | 1,992 |
2021-03-31 | 45,192 | -4,084 | 2,151 |
2020-12-31 | 41,404 | -3,536 | 1,121 |
2020-09-30 | 39,577 | -1,623 | 503 |
BG's Quality Factors
The “Quality” component of the POWR Ratings focuses on 31 different factors of a companies fundamentals and operational strength. Here are some key insights as we drill into the specifics of these quality attributes.- BG has a Quality Grade of C, ranking ahead of 64.12% of graded US stocks.
- BG's asset turnover comes in at 2.262 -- ranking 3rd of 59 Food Products stocks.
- SAFM, DAR, and MDLZ are the stocks whose asset turnover ratios are most correlated with BG.
The table below shows BG's key quality metrics over time.
Period | Asset Turnover | Gross Margin | ROIC |
---|---|---|---|
2021-09-30 | 2.262 | 0.065 | 0.154 |
2021-06-30 | 2.175 | 0.065 | 0.135 |
2021-03-31 | 2.066 | 0.083 | 0.159 |
2020-12-31 | 2.030 | 0.067 | 0.097 |
2020-09-30 | 2.077 | 0.062 | 0.061 |
2020-06-30 | 2.145 | 0.022 | -0.049 |
BG Price Target
For more insight on analysts targets of BG, see our BG price target page. And for a list of of all stocks sorted by upside potential based on analyst target price, see our Top Price Target page.
Average Price Target | $101.55 | Average Broker Recommendation | 1.6 (Moderate Buy) |
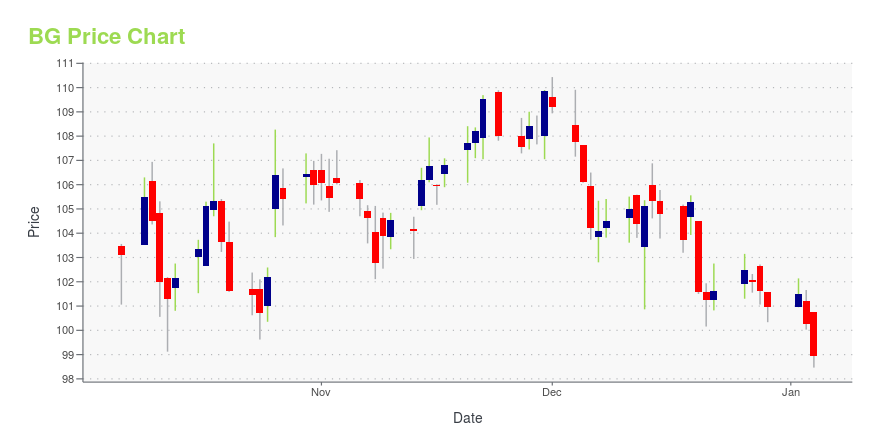
BG Stock Price Chart Interactive Chart >
BG Price/Volume Stats
Current price | $115.73 | 52-week high | $128.40 |
Prev. close | $115.46 | 52-week low | $71.73 |
Day low | $114.32 | Volume | 1,165,300 |
Day high | $116.79 | Avg. volume | 1,601,148 |
50-day MA | $114.30 | Dividend yield | 1.85% |
200-day MA | $96.27 | Market Cap | 17.56B |
Bunge Ltd. (BG) Company Bio
Bunge buys, sells, stores and transports oilseeds and grains to serve customers worldwide; processes oilseeds to make protein meal for animal feed and edible oil products for commercial customers and consumers; produces sugar and ethanol from sugarcane; mills wheat, corn and rice to make ingredients used by food companies; and sells fertilizer in South America. Founded in 1818, the company is based in White Plains, New York.
Latest BG News From Around the Web
Below are the latest news stories about Bunge LTD that investors may wish to consider to help them evaluate BG as an investment opportunity.
Bunge Limited Declares Dividends on Common and Preference SharesST. LOUIS, February 24, 2022--Bunge Limited (NYSE: BG) announced that its Board of Directors has declared on February 23, 2022 a common quarterly cash dividend of $0.525 per share. The dividend is payable on June 2, 2022 to holders of record on May 19, 2022. |
Bunge finalizes agreement for $600M joint venture with energy giantThe joint venture is to involve Chevron investing $600 million into a pair of Bunge facilities that process oil from soybeans. The idea would be to double the facilities’ current production of 7,000 tons daily by the end of 2024, and use the oil as a renewable feedstock to make low-carbon diesel or jet fuel. |
Chevron, Bunge Announce Definitive Agreements to Create Joint VentureSAN RAMON, Calif. & ST. LOUIS, February 22, 2022--Chevron U.S.A. Inc., a subsidiary of Chevron Corporation (NYSE: CVX), and Bunge North America, Inc., a subsidiary of Bunge Limited (NYSE: BG), today announced the signing of definitive transaction agreements to create their previously announced joint venture. The new venture will create renewable feedstocks leveraging Bunge’s expertise in oilseed processing and farmer relationships and Chevron’s expertise in fuels manufacturing and marketing. The |
Bunge Limited and Intuitive Surgical, Inc. highlighted as Zacks Bull and Bear of the DayBunge Limited and Intuitive Surgical, Inc. highlighted as Zacks Bull and Bear of the Day. |
Bull of the Day: Bunge (BG)This food company expects strong momentum to continue in 2022. |
BG Price Returns
1-mo | 1.21% |
3-mo | 10.52% |
6-mo | 29.16% |
1-year | 34.67% |
3-year | 149.47% |
5-year | 63.14% |
YTD | 25.17% |
2021 | 45.87% |
2020 | 18.92% |
2019 | 10.75% |
2018 | -17.99% |
2017 | -4.76% |
BG Dividends
Ex-Dividend Date | Type | Payout Amount | Change | ||||||
---|---|---|---|---|---|---|---|---|---|
Loading, please wait... |
Continue Researching BG
Want to do more research on Bunge LTD's stock and its price? Try the links below:Bunge LTD (BG) Stock Price | Nasdaq
Bunge LTD (BG) Stock Quote, History and News - Yahoo Finance
Bunge LTD (BG) Stock Price and Basic Information | MarketWatch
Loading social stream, please wait...