Bausch Health Companies Inc. (BHC): Price and Financial Metrics
GET POWR RATINGS... FREE!
BHC POWR Grades
- Value is the dimension where BHC ranks best; there it ranks ahead of 96.35% of US stocks.
- The strongest trend for BHC is in Momentum, which has been heading down over the past 179 days.
- BHC's current lowest rank is in the Momentum metric (where it is better than 8.18% of US stocks).
BHC Stock Summary
- Bausch Health Companies Inc's capital turnover -- a measure of revenue relative to shareholder's equity -- is better than merely 0.31% of US listed stocks.
- BHC's equity multiplier -- a measure of assets relative to shareholders'equity -- is greater than that of only 0.24% of US stocks.
- Shareholder yield, a measure of how much is returned to shareholders via dividends and share repurchases, for BHC comes in at 17.18% -- higher than that of 90.05% of stocks in our set.
- If you're looking for stocks that are quantitatively similar to Bausch Health Companies Inc, a group of peers worth examining would be SRLP, DMS, CAR, CTK, and MAS.
- BHC's SEC filings can be seen here. And to visit Bausch Health Companies Inc's official web site, go to www.bauschhealth.com.
BHC Valuation Summary
- BHC's price/sales ratio is 1.2; this is 89.43% lower than that of the median Healthcare stock.
- BHC's price/sales ratio has moved down 18 over the prior 243 months.
- Over the past 243 months, BHC's price/sales ratio has gone down 18.
Below are key valuation metrics over time for BHC.
Stock | Date | P/S | P/B | P/E | EV/EBIT |
---|---|---|---|---|---|
BHC | 2021-08-31 | 1.2 | -15.2 | -8.1 | -320.4 |
BHC | 2021-08-30 | 1.2 | -15.2 | -8.1 | -320.3 |
BHC | 2021-08-27 | 1.2 | -15.1 | -8.1 | -319.7 |
BHC | 2021-08-26 | 1.2 | -14.7 | -7.8 | -316.7 |
BHC | 2021-08-25 | 1.2 | -15.1 | -8.0 | -319.3 |
BHC | 2021-08-24 | 1.2 | -15.0 | -8.0 | -318.7 |
BHC Growth Metrics
- The 4 year net income to common stockholders growth rate now stands at -155.45%.
- Its 5 year net cashflow from operations growth rate is now at -40.51%.
- Its 3 year net cashflow from operations growth rate is now at -34.91%.

The table below shows BHC's growth in key financial areas (numbers in millions of US dollars).
Date | Revenue | Operating Cash Flow | Net Income to Common Stock |
---|---|---|---|
2021-09-30 | 8,451 | 1,796 | -1,170 |
2021-06-30 | 8,478 | 1,488 | -1,287 |
2021-03-31 | 8,042 | 1,293 | -1,018 |
2020-12-31 | 8,027 | 1,111 | -560 |
2020-09-30 | 8,038 | 951 | -1,923 |
2020-06-30 | 8,109 | 1,210 | -2,043 |
BHC's Quality Factors
The “Quality” component of the POWR Ratings focuses on 31 different factors of a companies fundamentals and operational strength. Here are some key insights as we drill into the specifics of these quality attributes.- BHC has a Quality Grade of C, ranking ahead of 53.93% of graded US stocks.
- BHC's asset turnover comes in at 0.276 -- ranking 162nd of 680 Pharmaceutical Products stocks.
- CCXI, NBY, and LLY are the stocks whose asset turnover ratios are most correlated with BHC.
The table below shows BHC's key quality metrics over time.
Period | Asset Turnover | Gross Margin | ROIC |
---|---|---|---|
2021-06-30 | 0.276 | 0.714 | -0.004 |
2021-03-31 | 0.259 | 0.714 | 0.006 |
2020-12-31 | 0.255 | 0.720 | 0.022 |
2020-09-30 | 0.250 | 0.721 | -0.017 |
2020-06-30 | 0.252 | 0.725 | -0.021 |
2020-03-31 | 0.265 | 0.729 | -0.011 |
BHC Price Target
For more insight on analysts targets of BHC, see our BHC price target page. And for a list of of all stocks sorted by upside potential based on analyst target price, see our Top Price Target page.
Average Price Target | $36.08 | Average Broker Recommendation | 1.62 (Moderate Buy) |
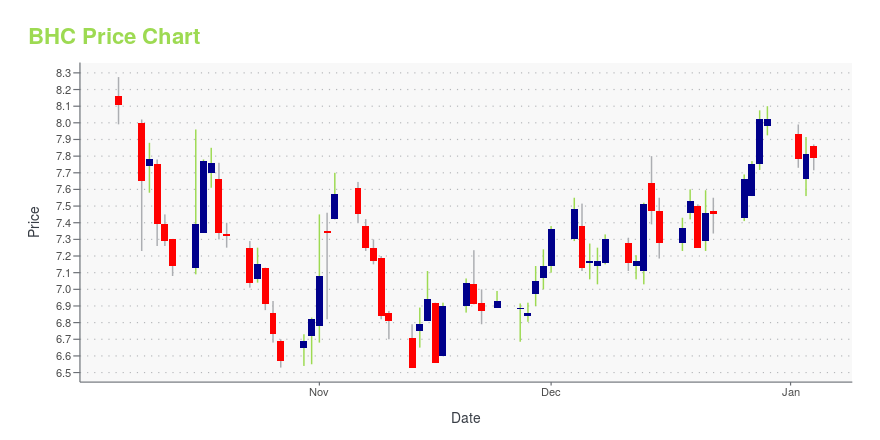
BHC Stock Price Chart Interactive Chart >
BHC Price/Volume Stats
Current price | $9.87 | 52-week high | $32.54 |
Prev. close | $9.86 | 52-week low | $7.80 |
Day low | $9.66 | Volume | 4,973,000 |
Day high | $9.93 | Avg. volume | 5,612,824 |
50-day MA | $18.33 | Dividend yield | N/A |
200-day MA | $24.38 | Market Cap | 3.56B |
Bausch Health Companies Inc. (BHC) Company Bio
Bausch Health Cos. Inc. (formerly) Valeant Pharmaceuticals is engaged in developing, manufacturing, and marketing a range of branded, generic and branded generic pharmaceuticals, over-the-counter products, and medical devices, including contact lenses, intraocular lenses, ophthalmic surgical equipment, and aesthetics devices. The company was founded in 1983 and is based in Laval, Canada.
Latest BHC News From Around the Web
Below are the latest news stories about Bausch Health Companies Inc that investors may wish to consider to help them evaluate BHC as an investment opportunity.
Bausch's (BHC) Q4 Earnings Beat Estimates, Revenues MissBausch (BHC) beats on earnings but misses on sales in the fourth quarter. The outlook for 2022 is disappointing. |
Bausch Health Announces Participation At The J.P. Morgan Global High Yield & Leveraged Finance ConferenceBausch Health Companies Inc. (NYSE/TSX: BHC) ("Bausch Health" or the "Company") today announced that Sam Eldessouky, executive vice president and chief financial officer; William Woodfield, senior vice president and treasurer; and Arthur J. Shannon, senior vice president and head of Investor Relations and Communications, are scheduled to participate at the J.P. Morgan Global High Yield & Leveraged Finance Conference in Miami on March 1, 2022 at 9:15 a.m. ET. |
Bausch Health Companies Inc. (BHC) CEO Joseph Papa on Q4 2021 Results - Earnings Call TranscriptBausch Health Companies Inc. (BHC) Q4 2021 Results Conference Call February 23, 2022 08:00 AM ET Company Participants Arthur Shannon - SVP, Head of IR Joseph Papa - Chairman, CEO Sam Eldessouky - CFO Thomas Appio - President, Co-Head Bausch + Lomb/International Scott Hirsch - CEO, Solta Medical Conference Call... |
Bausch Health Swings to Profit in Q4Bausch Health Companies (TSE: BHC) (NYSE: BHC) swung to a profit from a loss in the fourth quarter of 2021. The manufacturer of health care products is fully ready to launch Solta and Bausch + Lomb IPOs. Revenues & Earnings Revenues came in at $2.196 billion for the quarter ended December 31, up 1% from $2.213 billion in the prior-year quarter. The company reported a GAAP net income of $69 million ($0.19 per share) in Q4 2021, compared to a net loss of $153 million (-$0.43 per share) in Q4 2020. |
Bausch Health (BHC) Beats Q4 Earnings EstimatesBausch (BHC) delivered earnings and revenue surprises of 17.59% and 0.45%, respectively, for the quarter ended December 2021. Do the numbers hold clues to what lies ahead for the stock? |
BHC Price Returns
1-mo | -50.00% |
3-mo | -59.47% |
6-mo | -60.44% |
1-year | -69.31% |
3-year | -55.30% |
5-year | -23.07% |
YTD | -64.25% |
2021 | 32.74% |
2020 | -30.48% |
2019 | 61.99% |
2018 | -11.12% |
2017 | 43.11% |
Continue Researching BHC
Want to do more research on Bausch Health Companies Inc's stock and its price? Try the links below:Bausch Health Companies Inc (BHC) Stock Price | Nasdaq
Bausch Health Companies Inc (BHC) Stock Quote, History and News - Yahoo Finance
Bausch Health Companies Inc (BHC) Stock Price and Basic Information | MarketWatch
Loading social stream, please wait...