Biogen Inc. (BIIB): Price and Financial Metrics
BIIB Price/Volume Stats
Current price | $254.33 | 52-week high | $319.76 |
Prev. close | $251.31 | 52-week low | $248.41 |
Day low | $251.54 | Volume | 255,827 |
Day high | $255.06 | Avg. volume | 999,141 |
50-day MA | $263.03 | Dividend yield | N/A |
200-day MA | $280.06 | Market Cap | 36.83B |
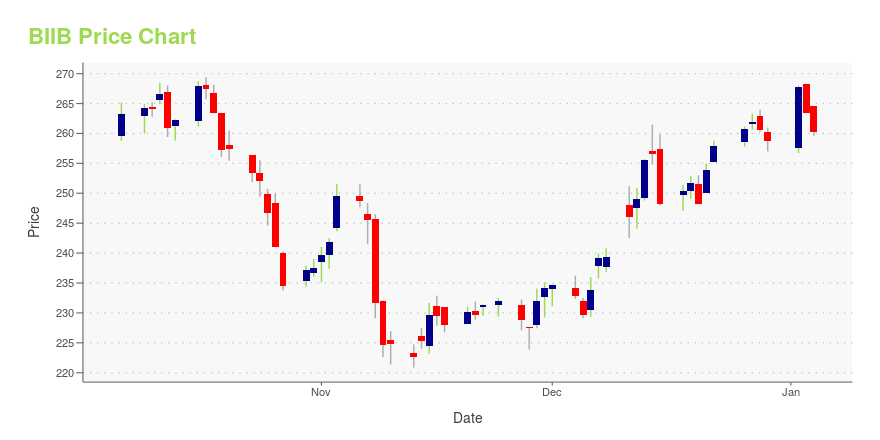
BIIB Stock Price Chart Interactive Chart >
BIIB POWR Grades
- Value is the dimension where BIIB ranks best; there it ranks ahead of 94.7% of US stocks.
- The strongest trend for BIIB is in Growth, which has been heading down over the past 177 days.
- BIIB ranks lowest in Growth; there it ranks in the 10th percentile.
BIIB Stock Summary
- BIIB has a market capitalization of $37,318,076,963 -- more than approximately 93.88% of US stocks.
- The price/operating cash flow metric for BIOGEN INC is higher than 84.16% of stocks in our set with a positive cash flow.
- The volatility of BIOGEN INC's share price is greater than that of merely 10.28% US stocks with at least 200 days of trading history.
- Stocks with similar financial metrics, market capitalization, and price volatility to BIOGEN INC are STM, NTES, BGNE, LUMO, and TVTX.
- Visit BIIB's SEC page to see the company's official filings. To visit the company's web site, go to www.biogen.com.
BIIB Valuation Summary
- BIIB's price/sales ratio is 3.7; this is 7.5% lower than that of the median Healthcare stock.
- BIIB's EV/EBIT ratio has moved down 9.2 over the prior 243 months.
Below are key valuation metrics over time for BIIB.
Stock | Date | P/S | P/B | P/E | EV/EBIT |
---|---|---|---|---|---|
BIIB | 2023-09-22 | 3.7 | 2.6 | 14.0 | 13.2 |
BIIB | 2023-09-21 | 3.8 | 2.6 | 14.1 | 13.3 |
BIIB | 2023-09-20 | 3.8 | 2.6 | 14.2 | 13.4 |
BIIB | 2023-09-19 | 3.7 | 2.6 | 14.0 | 13.2 |
BIIB | 2023-09-18 | 3.7 | 2.5 | 13.8 | 13.0 |
BIIB | 2023-09-15 | 3.7 | 2.6 | 13.8 | 13.1 |
BIIB Growth Metrics
- Its 5 year revenue growth rate is now at 25.06%.
- The 4 year cash and equivalents growth rate now stands at 180.44%.
- The year over year revenue growth rate now stands at -14.16%.

The table below shows BIIB's growth in key financial areas (numbers in millions of US dollars).
Date | Revenue | Operating Cash Flow | Net Income to Common Stock |
---|---|---|---|
2022-12-31 | 10,173.4 | 1,384.3 | 3,046.9 |
2022-09-30 | 10,363.2 | 2,397.6 | 2,864.7 |
2022-06-30 | 10,633.6 | 2,541.9 | 2,059.2 |
2022-03-31 | 10,819.5 | 3,032.7 | 1,449.7 |
2021-12-31 | 10,981.7 | 3,639.9 | 1,556.1 |
2021-09-30 | 11,100.5 | 2,434.5 | 1,545.8 |
BIIB's Quality Factors
The “Quality” component of the POWR Ratings focuses on 31 different factors of a companies fundamentals and operational strength. Here are some key insights as we drill into the specifics of these quality attributes.- BIIB has a Quality Grade of B, ranking ahead of 87.69% of graded US stocks.
- BIIB's asset turnover comes in at 0.459 -- ranking 97th of 680 Pharmaceutical Products stocks.
- ZSAN, ARMP, and HGEN are the stocks whose asset turnover ratios are most correlated with BIIB.
The table below shows BIIB's key quality metrics over time.
Period | Asset Turnover | Gross Margin | ROIC |
---|---|---|---|
2021-09-30 | 0.459 | 0.825 | 0.064 |
2021-06-30 | 0.478 | 0.839 | 0.098 |
2021-03-31 | 0.510 | 0.855 | 0.206 |
2020-12-31 | 0.531 | 0.866 | 0.283 |
2020-09-30 | 0.550 | 0.876 | 0.369 |
2020-06-30 | 0.545 | 0.880 | 0.415 |
BIIB Price Target
For more insight on analysts targets of BIIB, see our BIIB price target page. And for a list of of all stocks sorted by upside potential based on analyst target price, see our Top Price Target page.
Average Price Target | $417.00 | Average Broker Recommendation | 1.64 (Moderate Buy) |
Biogen Inc. (BIIB) Company Bio
Biogen Inc. is an American multinational biotechnology company based in Cambridge, Massachusetts, specializing in the discovery, development, and delivery of therapies for the treatment of neurological diseases to patients worldwide.(Source:Wikipedia)
Latest BIIB News From Around the Web
Below are the latest news stories about BIOGEN INC that investors may wish to consider to help them evaluate BIIB as an investment opportunity.
FDA Approves Biogen’s TOFIDENCE™ (tocilizumab-bavi), a Biosimilar Referencing ACTEMRA®TOFIDENCE (BIIB800) becomes the first tocilizumab biosimilar to gain FDA approval in the United StatesFDA approval is based on a robust analytical, non-clinical and clinical data package comparing TOFIDENCE to the reference product ACTEMRA CAMBRIDGE, Mass., Sept. 29, 2023 (GLOBE NEWSWIRE) -- Biogen Inc. (Nasdaq: BIIB) announced that the U.S. Food and Drug Administration (FDA) has approved TOFIDENCE (tocilizumab-bavi) intravenous formulation, a biosimilar monoclonal antibody referencing ACTEMRA. |
Is Eli Lilly Stock A Buy Now That It Has Topped A Profit-Taking Zone?Eli Lilly surged 15% in one day on enthusiasm for weight-loss and Alzheimer’s drugs. But is LLY stock a buy now? Here's what you should know. |
Is Biogen Stock a Buy Now?It has been one of the most talked about biotechs in recent years, but that's not enough to make its shares a buy. |
Ionis (IONS) Inks New Deal With Roche to Develop Novel RNA DrugsPer the agreement, Ionis (IONS) will grant exclusive global rights to Roche to develop and market two novel RNA-therapeutics for Alzheimer's and Huntington's diseases. |
Ionis (IONS) Meets Rare Disease Drug Study Goal, Stock Up 8.5%Ionis (IONS) reports positive phase III study results, supporting the benefits of olezarsen to treat familial chylomicronemia syndrome (FCS), a rare genetic disorder. |
BIIB Price Returns
1-mo | N/A |
3-mo | -10.76% |
6-mo | N/A |
1-year | -4.91% |
3-year | -8.40% |
5-year | -25.65% |
YTD | -8.16% |
2022 | 15.42% |
2021 | -2.02% |
2020 | -17.48% |
2019 | -1.39% |
2018 | -5.54% |
Continue Researching BIIB
Want to see what other sources are saying about Biogen Inc's financials and stock price? Try the links below:Biogen Inc (BIIB) Stock Price | Nasdaq
Biogen Inc (BIIB) Stock Quote, History and News - Yahoo Finance
Biogen Inc (BIIB) Stock Price and Basic Information | MarketWatch
Loading social stream, please wait...