Bio-Rad Laboratories Inc. CI A (BIO): Price and Financial Metrics
BIO Price/Volume Stats
Current price | $345.87 | 52-week high | $494.05 |
Prev. close | $349.56 | 52-week low | $261.59 |
Day low | $345.05 | Volume | 137,900 |
Day high | $350.32 | Avg. volume | 200,928 |
50-day MA | $331.20 | Dividend yield | N/A |
200-day MA | $344.66 | Market Cap | 9.86B |
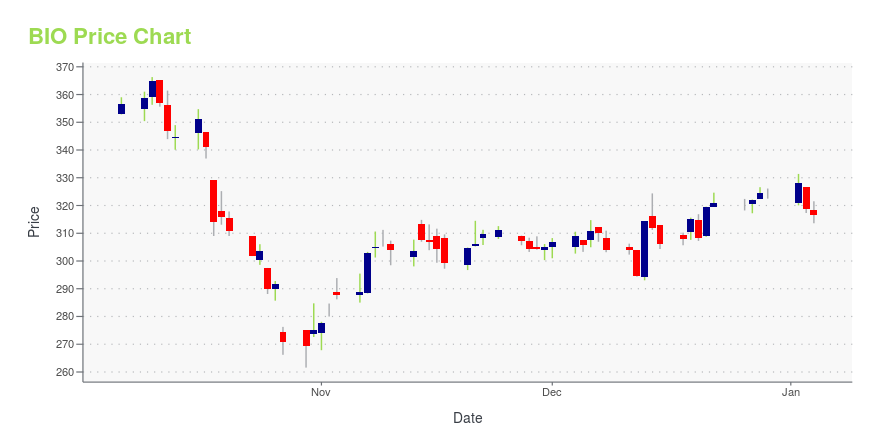
BIO Stock Price Chart Interactive Chart >
BIO POWR Grades
- Value is the dimension where BIO ranks best; there it ranks ahead of 80.61% of US stocks.
- BIO's strongest trending metric is Growth; it's been moving down over the last 26 weeks.
- BIO ranks lowest in Momentum; there it ranks in the 7th percentile.
BIO Stock Summary
- BIO-RAD LABORATORIES INC's market capitalization of $9,293,228,906 is ahead of 82.05% of US-listed equities.
- BIO's went public 38.03 years ago, making it older than 92.92% of listed US stocks we're tracking.
- Over the past twelve months, BIO has reported earnings growth of -98.32%, putting it ahead of merely 13.51% of US stocks in our set.
- Stocks with similar financial metrics, market capitalization, and price volatility to BIO-RAD LABORATORIES INC are SRTS, SEMR, EXAS, CVV, and HBIO.
- BIO's SEC filings can be seen here. And to visit BIO-RAD LABORATORIES INC's official web site, go to www.bio-rad.com.
BIO Valuation Summary
- BIO's price/sales ratio is 3.5; this is 59.09% higher than that of the median Healthcare stock.
- Over the past 243 months, BIO's price/sales ratio has gone up 2.
Below are key valuation metrics over time for BIO.
Stock | Date | P/S | P/B | P/E | EV/EBIT |
---|---|---|---|---|---|
BIO | 2023-12-29 | 3.5 | 1.1 | -61.3 | -79.1 |
BIO | 2023-12-28 | 3.5 | 1.1 | -61.6 | -79.5 |
BIO | 2023-12-27 | 3.5 | 1.1 | -61.2 | -78.9 |
BIO | 2023-12-26 | 3.4 | 1.1 | -60.9 | -78.7 |
BIO | 2023-12-22 | 3.4 | 1.1 | -60.9 | -78.6 |
BIO | 2023-12-21 | 3.4 | 1.1 | -60.7 | -78.4 |
BIO Growth Metrics
- Its year over year price growth rate is now at -18.74%.
- The year over year net income to common stockholders growth rate now stands at -102.47%.
- The 3 year cash and equivalents growth rate now stands at 75.99%.
The table below shows BIO's growth in key financial areas (numbers in millions of US dollars).
Date | Revenue | Operating Cash Flow | Net Income to Common Stock |
---|---|---|---|
2022-12-31 | 2,802.249 | 194.447 | -3,627.535 |
2022-09-30 | 2,804.73 | 261.951 | -6,034.688 |
2022-06-30 | 2,870.979 | 484.8 | -1,942.423 |
2022-03-31 | 2,895.811 | 589.226 | -101.125 |
2021-12-31 | 2,922.545 | 656.521 | 4,245.902 |
2021-09-30 | 2,979.615 | 783.331 | 6,658.663 |
BIO's Quality Factors
The “Quality” component of the POWR Ratings focuses on 31 different factors of a companies fundamentals and operational strength. Here are some key insights as we drill into the specifics of these quality attributes.- BIO has a Quality Grade of B, ranking ahead of 77.91% of graded US stocks.
- BIO's asset turnover comes in at 0.192 -- ranking 66th of 75 Measuring and Control Equipment stocks.
- AATC, HTGM, and WAT are the stocks whose asset turnover ratios are most correlated with BIO.
The table below shows BIO's key quality metrics over time.
Period | Asset Turnover | Gross Margin | ROIC |
---|---|---|---|
2021-09-30 | 0.192 | 0.570 | 0.617 |
2021-06-30 | 0.213 | 0.566 | 0.439 |
2021-03-31 | 0.220 | 0.563 | 0.497 |
2020-12-31 | 0.233 | 0.565 | 0.520 |
2020-09-30 | 0.245 | 0.550 | 0.549 |
2020-06-30 | 0.270 | 0.544 | 0.346 |
BIO Price Target
For more insight on analysts targets of BIO, see our BIO price target page. And for a list of of all stocks sorted by upside potential based on analyst target price, see our Top Price Target page.
Average Price Target | $856.25 | Average Broker Recommendation | 1.25 (Strong Buy) |
Bio-Rad Laboratories Inc. CI A (BIO) Company Bio
Bio-Rad Laboratories, Inc. is an American developer and manufacturer of specialized technological products for the life science research and clinical diagnostics markets. The company was founded in 1952 in Berkeley, California, by husband and wife team David and Alice Schwartz, both graduates of the University of California, Berkeley. Bio-Rad is based in Hercules, California, and has operations worldwide. (Source:Wikipedia)
Latest BIO News From Around the Web
Below are the latest news stories about BIO-RAD LABORATORIES INC that investors may wish to consider to help them evaluate BIO as an investment opportunity.
6 Cheap Healthcare Stock Picks With Room to Grow in 2024After an abysmal year for healthcare stocks, Wall Street is upbeat on Cigna, Humana, Bristol Myers, and three others. |
Bio-Rad (BIO) Faces Soft Industry-wide Demand, Macro WoesBio-Rad's (BIO) margin performance suffers due to elevated raw material costs, increased logistics costs and higher employee-related expenses. |
Investors Aren't Entirely Convinced By Bio-Rad Laboratories, Inc.'s (NYSE:BIO) RevenuesWith a median price-to-sales (or "P/S") ratio of close to 3.9x in the Life Sciences industry in the United States, you... |
Why Is Phibro (PAHC) Up 13.6% Since Last Earnings Report?Phibro (PAHC) reported earnings 30 days ago. What's next for the stock? We take a look at earnings estimates for some clues. |
Why Is Zimmer (ZBH) Up 10.8% Since Last Earnings Report?Zimmer (ZBH) reported earnings 30 days ago. What's next for the stock? We take a look at earnings estimates for some clues. |
BIO Price Returns
1-mo | 4.89% |
3-mo | 7.12% |
6-mo | -3.51% |
1-year | -26.72% |
3-year | -39.33% |
5-year | 13.15% |
YTD | 7.12% |
2023 | -23.21% |
2022 | -44.35% |
2021 | 29.61% |
2020 | 57.54% |
2019 | 59.34% |
Continue Researching BIO
Want to see what other sources are saying about Bio-Rad Laboratories Inc's financials and stock price? Try the links below:Bio-Rad Laboratories Inc (BIO) Stock Price | Nasdaq
Bio-Rad Laboratories Inc (BIO) Stock Quote, History and News - Yahoo Finance
Bio-Rad Laboratories Inc (BIO) Stock Price and Basic Information | MarketWatch
Loading social stream, please wait...