Bio-Rad Laboratories Inc. CI A (BIO): Price and Financial Metrics
BIO Price/Volume Stats
Current price | $371.84 | 52-week high | $572.70 |
Prev. close | $371.36 | 52-week low | $344.63 |
Day low | $370.08 | Volume | 106,001 |
Day high | $376.35 | Avg. volume | 183,934 |
50-day MA | $429.67 | Dividend yield | N/A |
200-day MA | $438.74 | Market Cap | 11.01B |
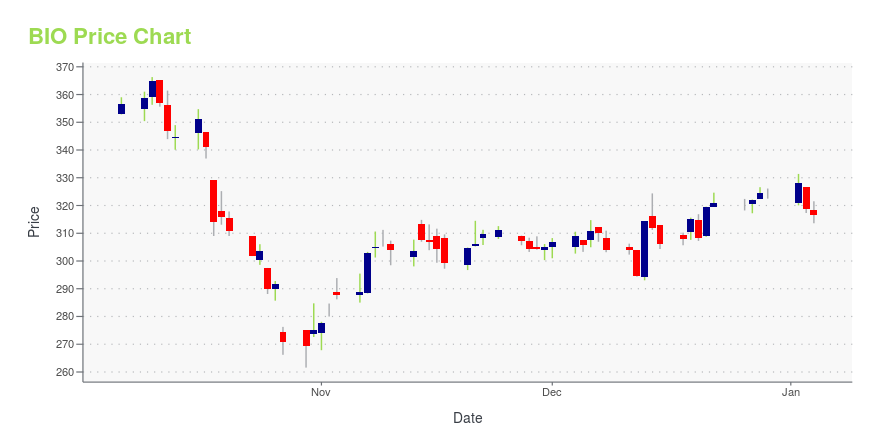
BIO Stock Price Chart Interactive Chart >
BIO POWR Grades
- BIO scores best on the Growth dimension, with a Growth rank ahead of 81.7% of US stocks.
- The strongest trend for BIO is in Growth, which has been heading up over the past 179 days.
- BIO's current lowest rank is in the Momentum metric (where it is better than 6.83% of US stocks).
BIO Stock Summary
- With a one year PEG ratio of 576.46, BIO-RAD LABORATORIES INC is expected to have a higher PEG ratio (a measure of how expensive a stock is relative to its expected earnings growth) than 95.83% of US stocks.
- BIO's went public 37.42 years ago, making it older than 93.61% of listed US stocks we're tracking.
- Price to trailing twelve month operating cash flow for BIO is currently 44.94, higher than 91.32% of US stocks with positive operating cash flow.
- If you're looking for stocks that are quantitatively similar to BIO-RAD LABORATORIES INC, a group of peers worth examining would be BRKR, AGCO, FMC, ITRN, and DAO.
- BIO's SEC filings can be seen here. And to visit BIO-RAD LABORATORIES INC's official web site, go to www.bio-rad.com.
BIO Valuation Summary
- In comparison to the median Healthcare stock, BIO's price/earnings ratio is 348.55% lower, now standing at -59.9.
- BIO's price/earnings ratio has moved down 79.5 over the prior 243 months.
Below are key valuation metrics over time for BIO.
Stock | Date | P/S | P/B | P/E | EV/EBIT |
---|---|---|---|---|---|
BIO | 2023-05-23 | 4.1 | 1.2 | -59.9 | -60.6 |
BIO | 2023-05-22 | 4.1 | 1.2 | -60.7 | -61.3 |
BIO | 2023-05-19 | 4.1 | 1.2 | -59.9 | -60.5 |
BIO | 2023-05-18 | 4.1 | 1.2 | -59.6 | -60.3 |
BIO | 2023-05-17 | 4.1 | 1.2 | -59.6 | -60.3 |
BIO | 2023-05-16 | 4.1 | 1.2 | -60.3 | -60.9 |
BIO Growth Metrics
- Its year over year price growth rate is now at -18.74%.
- The year over year net income to common stockholders growth rate now stands at -102.47%.
- The 3 year cash and equivalents growth rate now stands at 75.99%.

The table below shows BIO's growth in key financial areas (numbers in millions of US dollars).
Date | Revenue | Operating Cash Flow | Net Income to Common Stock |
---|---|---|---|
2022-12-31 | 2,802.249 | 194.447 | -3,627.535 |
2022-09-30 | 2,804.73 | 261.951 | -6,034.688 |
2022-06-30 | 2,870.979 | 484.8 | -1,942.423 |
2022-03-31 | 2,895.811 | 589.226 | -101.125 |
2021-12-31 | 2,922.545 | 656.521 | 4,245.902 |
2021-09-30 | 2,979.615 | 783.331 | 6,658.663 |
BIO's Quality Factors
The “Quality” component of the POWR Ratings focuses on 31 different factors of a companies fundamentals and operational strength. Here are some key insights as we drill into the specifics of these quality attributes.- BIO has a Quality Grade of B, ranking ahead of 77.91% of graded US stocks.
- BIO's asset turnover comes in at 0.192 -- ranking 66th of 75 Measuring and Control Equipment stocks.
- AATC, HTGM, and WAT are the stocks whose asset turnover ratios are most correlated with BIO.
The table below shows BIO's key quality metrics over time.
Period | Asset Turnover | Gross Margin | ROIC |
---|---|---|---|
2021-09-30 | 0.192 | 0.570 | 0.617 |
2021-06-30 | 0.213 | 0.566 | 0.439 |
2021-03-31 | 0.220 | 0.563 | 0.497 |
2020-12-31 | 0.233 | 0.565 | 0.520 |
2020-09-30 | 0.245 | 0.550 | 0.549 |
2020-06-30 | 0.270 | 0.544 | 0.346 |
BIO Price Target
For more insight on analysts targets of BIO, see our BIO price target page. And for a list of of all stocks sorted by upside potential based on analyst target price, see our Top Price Target page.
Average Price Target | $856.25 | Average Broker Recommendation | 1.25 (Strong Buy) |
Bio-Rad Laboratories Inc. CI A (BIO) Company Bio
Bio-Rad Laboratories, Inc. is an American developer and manufacturer of specialized technological products for the life science research and clinical diagnostics markets. The company was founded in 1952 in Berkeley, California, by husband and wife team David and Alice Schwartz, both graduates of the University of California, Berkeley. Bio-Rad is based in Hercules, California, and has operations worldwide. (Source:Wikipedia)
Latest BIO News From Around the Web
Below are the latest news stories about BIO-RAD LABORATORIES INC that investors may wish to consider to help them evaluate BIO as an investment opportunity.
Bio-Rad Laboratories First Quarter 2023 Earnings: EPS: US$2.33 (vs US$112 loss in 1Q 2022)Bio-Rad Laboratories ( NYSE:BIO ) First Quarter 2023 Results Key Financial Results Revenue: US$676.8m (down 3.3% from... |
Bio-Rad to Participate in Fireside Chat During 2023 RBC Capital Markets Global Healthcare ConferenceHERCULES, Calif., May 08, 2023--Bio-Rad Laboratories, Inc. (NYSE: BIO and BIOb), a global leader in life science research and clinical diagnostic products, today announced that the company’s management will participate in a fireside chat event during the 2023 RBC Capital Markets Global Healthcare Conference on Wednesday, May 17, 2023, at 3:35 PM Eastern Time (12:35 PM Pacific Time). |
Stocks Roar Back To Life; Still Pacing For Weekly LossRebounding bank stocks, stellar Apple earnings, and a blowout jobs report are all helping stocks move significantly higher Friday afternoon. |
Bio-Rad (BIO) Q1 Earnings Beat Estimates, Operating Margin DownBio-Rad's (BIO) first-quarter results reflect core strength across the Life Science and Clinical Diagnostics segments amid ongoing supply-chain constraints. |
Bio-Rad Laboratories (BIO) Q1 Earnings and Revenues Beat EstimatesBio-Rad (BIO) delivered earnings and revenue surprises of 3.09% and 0.40%, respectively, for the quarter ended March 2023. Do the numbers hold clues to what lies ahead for the stock? |
BIO Price Returns
1-mo | -19.84% |
3-mo | -26.08% |
6-mo | -11.27% |
1-year | -32.70% |
3-year | -24.59% |
5-year | 27.94% |
YTD | -11.57% |
2022 | -44.35% |
2021 | 29.61% |
2020 | 57.54% |
2019 | 59.34% |
2018 | -2.70% |
Continue Researching BIO
Want to see what other sources are saying about Bio-Rad Laboratories Inc's financials and stock price? Try the links below:Bio-Rad Laboratories Inc (BIO) Stock Price | Nasdaq
Bio-Rad Laboratories Inc (BIO) Stock Quote, History and News - Yahoo Finance
Bio-Rad Laboratories Inc (BIO) Stock Price and Basic Information | MarketWatch
Loading social stream, please wait...