BJ's Restaurants, Inc. (BJRI): Price and Financial Metrics


BJ's Restaurants, Inc. (BJRI): $29.52

-0.01 (-0.03%)

POWR Rating

Component Grades

Growth

S

Value

I

Momentum

G

Stability

N

Sentiment

U

Quality

P

Add BJRI to Watchlist
Sign Up

Industry: Restaurants


Ranked

of

in industry

BJRI POWR Grades

  • Value is the dimension where BJRI ranks best; there it ranks ahead of 70.72% of US stocks.
  • BJRI's strongest trending metric is Growth; it's been moving up over the last 178 days.
  • BJRI's current lowest rank is in the Sentiment metric (where it is better than 14.13% of US stocks).

BJRI Stock Summary

  • BJS RESTAURANTS INC's capital turnover -- a measure of revenue relative to shareholder's equity -- is better than 86.76% of US listed stocks.
  • BJRI's current price/earnings ratio is 170.41, which is higher than 97.34% of US stocks with positive earnings.
  • With a price/sales ratio of 0.54, BJS RESTAURANTS INC has a higher such ratio than merely 19.27% of stocks in our set.
  • Stocks that are quantitatively similar to BJRI, based on their financial statements, market capitalization, and price volatility, are RVLV, HSIC, TCS, VFC, and BGSF.
  • Visit BJRI's SEC page to see the company's official filings. To visit the company's web site, go to www.bjsrestaurants.com.

BJRI Valuation Summary

  • BJRI's EV/EBIT ratio is -225.2; this is 1806.06% lower than that of the median Consumer Cyclical stock.
  • BJRI's price/earnings ratio has moved up 123.8 over the prior 243 months.

Below are key valuation metrics over time for BJRI.

Stock Date P/S P/B P/E EV/EBIT
BJRI 2023-03-16 0.6 2.1 174.9 -225.2
BJRI 2023-03-15 0.5 2.0 170.0 -221.5
BJRI 2023-03-14 0.5 2.0 166.4 -218.8
BJRI 2023-03-13 0.5 1.9 165.2 -217.9
BJRI 2023-03-10 0.5 2.0 170.1 -221.6
BJRI 2023-03-09 0.6 2.1 174.3 -224.8

BJRI Growth Metrics

    Its 2 year net cashflow from operations growth rate is now at -46.74%.
  • Its 5 year cash and equivalents growth rate is now at 240.84%.
  • The 5 year price growth rate now stands at -55.73%.
Over the past 33 months, BJRI's revenue has gone up $69,592,000.

The table below shows BJRI's growth in key financial areas (numbers in millions of US dollars).

Date Revenue Operating Cash Flow Net Income to Common Stock
2022-09-30 1,231.042 51.833 -4.543
2022-06-30 1,201.874 40.999 -5.077
2022-03-31 1,162.46 50.682 0.995
2021-12-31 1,087.038 64.285 -3.606
2021-09-30 992.774 50.561 -17.032
2021-06-30 909.481 79.461 -21.44

BJRI's Quality Factors

The “Quality” component of the POWR Ratings focuses on 31 different factors of a companies fundamentals and operational strength. Here are some key insights as we drill into the specifics of these quality attributes.
  • BJRI has a Quality Grade of C, ranking ahead of 43.45% of graded US stocks.
  • BJRI's asset turnover comes in at 0.933 -- ranking 19th of 79 Restaraunts Hotels Motels stocks.
  • CAKE, DENN, and RRGB are the stocks whose asset turnover ratios are most correlated with BJRI.

The table below shows BJRI's key quality metrics over time.

Period Asset Turnover Gross Margin ROIC
2021-09-28 0.933 0.739 -0.020
2021-06-29 0.850 0.745 -0.022
2021-03-30 0.693 0.749 -0.056
2020-12-29 0.717 0.749 -0.055
2020-09-29 0.802 0.750 -0.031
2020-06-30 0.877 0.747 -0.022

BJRI Price Target

For more insight on analysts targets of BJRI, see our BJRI price target page. And for a list of of all stocks sorted by upside potential based on analyst target price, see our Top Price Target page.

Average Price Target $52.46 Average Broker Recommendation 1.7 (Moderate Buy)

BJRI Stock Price Chart Interactive Chart >

Price chart for BJRI

BJRI Price/Volume Stats
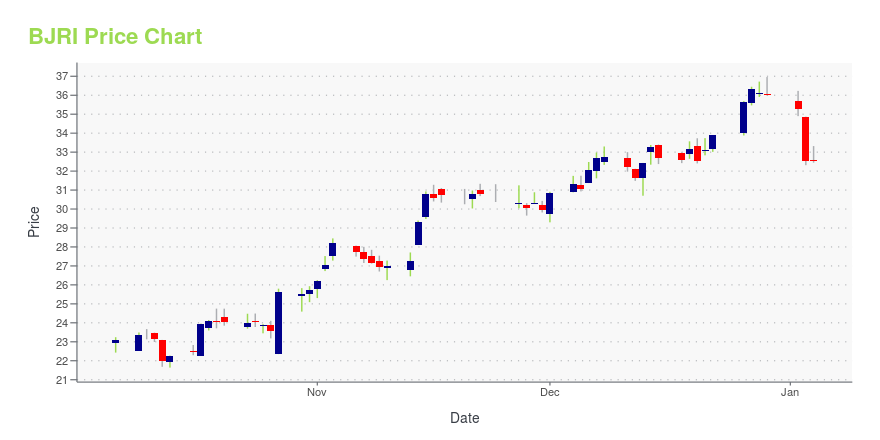
Current price $29.52 52-week high $36.14
Prev. close $29.53 52-week low $20.15
Day low $29.46 Volume 220,600
Day high $30.40 Avg. volume 310,180
50-day MA $31.82 Dividend yield N/A
200-day MA $27.87 Market Cap 694.61M

BJ's Restaurants, Inc. (BJRI) Company Bio


BJ's Restaurants owns and operates casual dining restaurants in the Unites States under the BJ’s Restaurant & Brewery, BJ’s Restaurant & Brewhouse, BJ’s Pizza & Grill, and BJ’s Grill brands. The company was founded in 1978 and is based in Huntington Beach, California.


BJRI Latest News Stream


Event/Time News Detail
Loading, please wait...

BJRI Latest Social Stream


Loading social stream, please wait...

View Full BJRI Social Stream

Latest BJRI News From Around the Web

Below are the latest news stories about BJS RESTAURANTS INC that investors may wish to consider to help them evaluate BJRI as an investment opportunity.

Here's Why You Should Retain BJ's Restaurants (BJRI) Stock

BJ's Restaurants (BJRI) emphasizes on reducing menu item count complexity to drive growth. However, inflationary pressures are concerning.

Yahoo | March 20, 2023

Raise a Toast to These 5 Stocks on St. Patrick's Day

Raise a toast to Diageo (DEO), Beyond Meat (BYND), BJ's Restaurants (BJRI), McDonald's (MCD) and Sprouts Farmers (SFM) to find some hidden luck on this Irish festival.

Yahoo | March 17, 2023

McDonald's (MCD) Gains From Expansion Efforts, Cost Woes Stay

McDonald's (MCD) benefits from expansion effort, menu innovation, comps growth and robust digitalization.

Yahoo | March 7, 2023

Brisk Sales Are Powering Restaurant Stocks

Even though inflation has remained stubbornly high of late, that hasn’t prevented restaurant companies—and their stocks—from thriving.

Yahoo | March 1, 2023

BJ’s Restaurants Opens in Orland Park, Illinois

HUNTINGTON BEACH, Calif., Feb. 27, 2023 (GLOBE NEWSWIRE) -- BJ’s Restaurants, Inc. (NASDAQ: BJRI) today announced the opening of its restaurant in Orland Park, Illinois. The new BJ’s Restaurant & Brewhouse opened today, February 27, 2023, on a free-standing pad near Orland Square Mall on South La Grange Road. The restaurant is approximately 7,500 square feet, seats approximately 250 guests and features BJ’s extensive menu, including BJ’s signature deep-dish pizza, award-winning handcrafted beer

Yahoo | February 27, 2023

Read More 'BJRI' Stories Here

BJRI Price Returns

1-mo N/A
3-mo 7.58%
6-mo 23.57%
1-year 8.21%
3-year 260.00%
5-year -30.44%
YTD 11.90%
2022 -23.65%
2021 -10.24%
2020 1.84%
2019 -24.08%
2018 40.05%

Continue Researching BJRI

Want to see what other sources are saying about BJs RESTAURANTS INC's financials and stock price? Try the links below:

BJs RESTAURANTS INC (BJRI) Stock Price | Nasdaq
BJs RESTAURANTS INC (BJRI) Stock Quote, History and News - Yahoo Finance
BJs RESTAURANTS INC (BJRI) Stock Price and Basic Information | MarketWatch

Get Free Updates

Join thousands of investors who get the latest news, insights and top rated picks from StockNews.com!


Page generated in 0.8641 seconds.