
Blackboxstocks Inc. (BLBX): Price and Financial Metrics
BLBX Price/Volume Stats
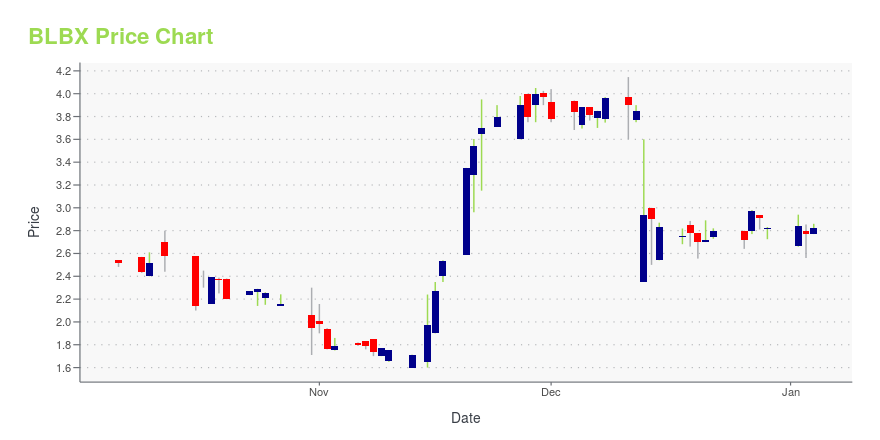
| Current price | $2.43 | 52-week high | $4.15 |
| Prev. close | $2.54 | 52-week low | $1.60 |
| Day low | $2.43 | Volume | 2,900 |
| Day high | $2.62 | Avg. volume | 16,831 |
| 50-day MA | $2.84 | Dividend yield | N/A |
| 200-day MA | $2.76 | Market Cap | 7.84M |
BLBX Stock Price Chart Interactive Chart >
Blackboxstocks Inc. (BLBX) Company Bio
Blackboxstocks, Inc. engages in the operation of a financial technology and social media platform. It offers real-time proprietary analytics and news for stock and option traders. The company was founded on October 4, 2011 and is headquartered in Dallas, TX.
Latest BLBX News From Around the Web
Below are the latest news stories about BLACKBOXSTOCKS INC that investors may wish to consider to help them evaluate BLBX as an investment opportunity.
Blackboxstocks, Inc. Signs Definitive Agreement to Acquire Evtec Aluminium, Supplier of Proprietary Parts for the EV, Hybrid, and Performance Automotive Market, with Projected Revenue of US$52 Million for Fiscal Year Ending June 30, 2024DALLAS, December 13, 2023--Blackboxstocks Inc. (NASDAQ: BLBX), ("Blackbox" or the "Company"), a financial technology and social media hybrid platform offering real-time proprietary analytics for stock and options traders, announced today that on December 12, 2023 it executed a definitive agreement to acquire Evtec Aluminium Limited ("Evtec"). The transaction is expected to close in the first quarter of 2024. |
Blackboxstocks Announces Third Quarter 2023 Financial ResultsDALLAS, November 14, 2023--Blackboxstocks Inc. (NASDAQ: BLBX), ("Blackbox" or the "Company"), a financial technology and social media hybrid platform offering real-time proprietary analytics for stock and options traders of all levels, today announced the Company’s financial results for the third quarter and nine months ended September 30, 2023. |
Blackboxstocks Joins Forces with GoNoGo Charts to Provide the Ultimate Trend Indicator for TradersDALLAS, September 18, 2023--Blackboxstocks Inc. (NASDAQ: BLBX), ("Blackbox" or the "Company"), a financial technology and social media hybrid platform offering real-time proprietary analytics for stock and options traders of all levels, announced today that it has integrated the GoNoGo Trend Indicator from GoNoGo Charts into the Blackbox platform. |
Blackboxstocks Announces Second Quarter 2023 Financial ResultsDALLAS, August 14, 2023--Blackboxstocks Inc. (NASDAQ: BLBX), ("Blackbox" or the "Company"), a financial technology and social media hybrid platform offering real-time proprietary analytics for stock and options traders of all levels, today announced the Company’s financial results for the second quarter and six months ended June 30, 2023. |
Blackboxstocks Launches Beta Program for StockNanny, an AI-Driven Portfolio Alert System Featuring Real-Time Market Data from Nasdaq BasicDALLAS, August 09, 2023--Blackboxstocks, Inc. (NASDAQ: BLBX) ("Blackbox"), a financial technology and social media hybrid platform offering real-time proprietary analytics for stock and options traders, today announced the launch of the beta program for the Company’s new portfolio alert product StockNanny, featuring real-time data from Nasdaq. |
BLBX Price Returns
| 1-mo | -15.33% |
| 3-mo | -10.00% |
| 6-mo | -27.25% |
| 1-year | -11.64% |
| 3-year | -77.79% |
| 5-year | N/A |
| YTD | -13.83% |
| 2023 | 135.00% |
| 2022 | -91.60% |
| 2021 | N/A |
| 2020 | N/A |
| 2019 | N/A |
Loading social stream, please wait...