Builders FirstSource, Inc. (BLDR): Price and Financial Metrics
BLDR Price/Volume Stats
Current price | $121.84 | 52-week high | $156.85 |
Prev. close | $121.02 | 52-week low | $52.70 |
Day low | $121.19 | Volume | 1,650,600 |
Day high | $124.51 | Avg. volume | 1,959,447 |
50-day MA | $139.73 | Dividend yield | N/A |
200-day MA | $105.31 | Market Cap | 15.23B |
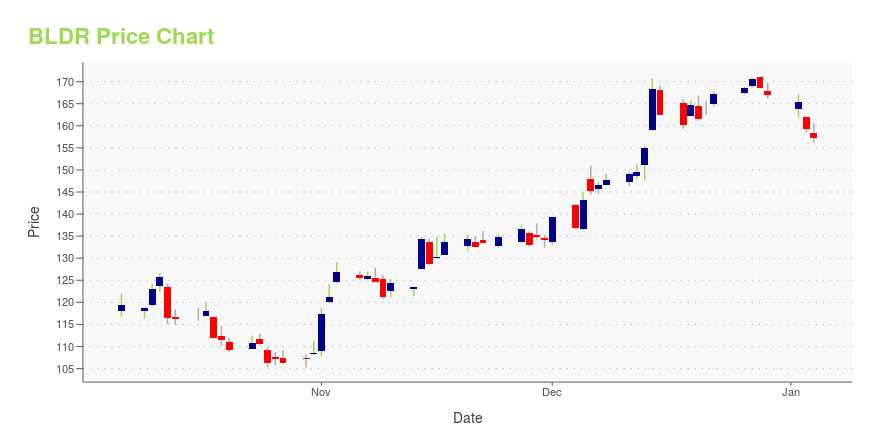
BLDR Stock Price Chart Interactive Chart >
BLDR POWR Grades
- BLDR scores best on the Momentum dimension, with a Momentum rank ahead of 95.66% of US stocks.
- The strongest trend for BLDR is in Stability, which has been heading down over the past 179 days.
- BLDR's current lowest rank is in the Growth metric (where it is better than 10.19% of US stocks).
BLDR Stock Summary
- BLDR has a higher market value than 88.43% of US stocks; more precisely, its current market capitalization is $16,143,481,107.
- BUILDERS FIRSTSOURCE INC's capital turnover -- a measure of revenue relative to shareholder's equity -- is better than 88.48% of US listed stocks.
- BUILDERS FIRSTSOURCE INC's shareholder yield -- a measure of how much capital is returned to stockholders via dividends and buybacks -- is 16.31%, greater than the shareholder yield of 89.1% of stocks in our set.
- Stocks with similar financial metrics, market capitalization, and price volatility to BUILDERS FIRSTSOURCE INC are WBA, EME, BBY, POOL, and CHRW.
- BLDR's SEC filings can be seen here. And to visit BUILDERS FIRSTSOURCE INC's official web site, go to www.bldr.com.
BLDR Valuation Summary
- In comparison to the median Basic Materials stock, BLDR's price/sales ratio is 30.77% lower, now standing at 0.9.
- BLDR's EV/EBIT ratio has moved up 1.1 over the prior 221 months.
Below are key valuation metrics over time for BLDR.
Stock | Date | P/S | P/B | P/E | EV/EBIT |
---|---|---|---|---|---|
BLDR | 2023-09-06 | 0.9 | 4.0 | 9.4 | 8.4 |
BLDR | 2023-09-05 | 0.9 | 3.9 | 9.2 | 8.2 |
BLDR | 2023-09-01 | 1.0 | 4.3 | 10.0 | 8.8 |
BLDR | 2023-08-31 | 1.0 | 4.2 | 9.7 | 8.6 |
BLDR | 2023-08-30 | 0.9 | 4.0 | 9.4 | 8.4 |
BLDR | 2023-08-29 | 0.9 | 4.0 | 9.4 | 8.3 |
BLDR Growth Metrics
- Its 3 year net income to common stockholders growth rate is now at 907.21%.
- Its 2 year price growth rate is now at 277.89%.
- Its 5 year price growth rate is now at 12.35%.

The table below shows BLDR's growth in key financial areas (numbers in millions of US dollars).
Date | Revenue | Operating Cash Flow | Net Income to Common Stock |
---|---|---|---|
2022-12-31 | 22,726.42 | 3,599.231 | 2,749.369 |
2022-09-30 | 23,003.66 | 3,468.198 | 2,807.312 |
2022-06-30 | 22,750.79 | 3,074.395 | 2,682.45 |
2022-03-31 | 21,401.21 | 2,123.879 | 2,192.476 |
2021-12-31 | 19,893.86 | 1,743.549 | 1,725.416 |
2021-09-30 | 17,789.81 | 1,008.138 | 1,422.874 |
BLDR's Quality Factors
The “Quality” component of the POWR Ratings focuses on 31 different factors of a companies fundamentals and operational strength. Here are some key insights as we drill into the specifics of these quality attributes.- BLDR has a Quality Grade of C, ranking ahead of 52.07% of graded US stocks.
- BLDR's asset turnover comes in at 2.034 -- ranking 47th of 165 Retail stocks.
- KAR, TJX, and MUSA are the stocks whose asset turnover ratios are most correlated with BLDR.
The table below shows BLDR's key quality metrics over time.
Period | Asset Turnover | Gross Margin | ROIC |
---|---|---|---|
2021-09-30 | 2.034 | 0.283 | 0.348 |
2021-06-30 | 2.068 | 0.267 | 0.261 |
2021-03-31 | 2.052 | 0.258 | 0.180 |
2020-12-31 | 2.207 | 0.260 | 0.153 |
2020-09-30 | 2.136 | 0.261 | 0.119 |
2020-06-30 | 2.156 | 0.268 | 0.119 |
BLDR Price Target
For more insight on analysts targets of BLDR, see our BLDR price target page. And for a list of of all stocks sorted by upside potential based on analyst target price, see our Top Price Target page.
Average Price Target | $64.38 | Average Broker Recommendation | 1.27 (Strong Buy) |
Builders FirstSource, Inc. (BLDR) Company Bio
Builders FirstSource manufactures and supplies structural and related building products for residential new construction primarily in the southern and eastern United States. The company was founded in 1998 and is based in Dallas, Texas.
Latest BLDR News From Around the Web
Below are the latest news stories about BUILDERS FIRSTSOURCE INC that investors may wish to consider to help them evaluate BLDR as an investment opportunity.
4 Stocks to Watch in the Strong Retail Building Products IndustryDigital initiatives, continued innovation, and strong Pro and DIY demand have been aiding the Retail Building Products industry players. HD, LOW, FAST and BLDR are well-poised for growth. |
Are Retail-Wholesale Stocks Lagging Builders FirstSource (BLDR) This Year?Here is how Builders FirstSource (BLDR) and Group 1 Automotive (GPI) have performed compared to their sector so far this year. |
Is Builders FirstSource (BLDR) a Buy as Wall Street Analysts Look Optimistic?According to the average brokerage recommendation (ABR), one should invest in Builders FirstSource (BLDR). It is debatable whether this highly sought-after metric is effective because Wall Street analysts' recommendations tend to be overly optimistic. Would it be worth investing in the stock? |
Wall Street Analysts Predict a 26.16% Upside in Builders FirstSource (BLDR): Here's What You Should KnowThe consensus price target hints at a 26.2% upside potential for Builders FirstSource (BLDR). While empirical research shows that this sought-after metric is hardly effective, an upward trend in earnings estimate revisions could mean that the stock will witness an upside in the near term. |
Builders FirstSource (BLDR) Forms 'Hammer Chart Pattern': Time for Bottom Fishing?Builders FirstSource (BLDR) appears to have found support after losing some value lately, as indicated by the formation of a hammer chart. In addition to this technical chart pattern, strong agreement among Wall Street analysts in revising earnings estimates higher enhances the stock's potential for a turnaround in the near term. |
BLDR Price Returns
1-mo | -10.81% |
3-mo | -4.45% |
6-mo | 44.26% |
1-year | 119.49% |
3-year | 295.20% |
5-year | 677.04% |
YTD | 87.79% |
2022 | -24.30% |
2021 | 110.02% |
2020 | 60.61% |
2019 | 132.91% |
2018 | -49.93% |
Continue Researching BLDR
Want to do more research on Builders FirstSource Inc's stock and its price? Try the links below:Builders FirstSource Inc (BLDR) Stock Price | Nasdaq
Builders FirstSource Inc (BLDR) Stock Quote, History and News - Yahoo Finance
Builders FirstSource Inc (BLDR) Stock Price and Basic Information | MarketWatch
Loading social stream, please wait...