Blue Foundry Bancorp (BLFY): Price and Financial Metrics
BLFY Price/Volume Stats
Current price | $8.40 | 52-week high | $13.17 |
Prev. close | $8.46 | 52-week low | $8.14 |
Day low | $8.34 | Volume | 71,400 |
Day high | $8.50 | Avg. volume | 101,849 |
50-day MA | $9.55 | Dividend yield | N/A |
200-day MA | $10.47 | Market Cap | 213.09M |
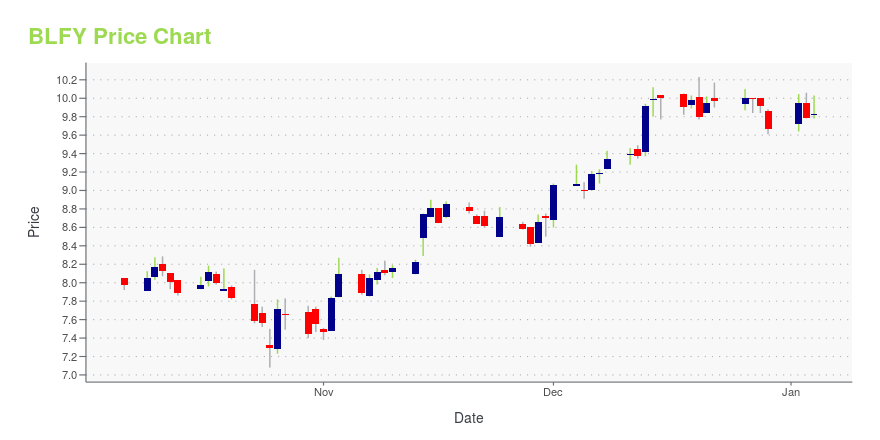
BLFY Stock Price Chart Interactive Chart >
BLFY POWR Grades
- BLFY scores best on the Stability dimension, with a Stability rank ahead of 83.22% of US stocks.
- BLFY's strongest trending metric is Growth; it's been moving down over the last 179 days.
- BLFY ranks lowest in Growth; there it ranks in the 5th percentile.
BLFY Stock Summary
- BLFY's went public 2.18 years ago, making it older than just 5.13% of listed US stocks we're tracking.
- For BLFY, its debt to operating expenses ratio is greater than that reported by 89.53% of US equities we're observing.
- Shareholder yield, a measure of how much is returned to shareholders via dividends and share repurchases, for BLFY comes in at -68.78% -- higher than that of only 8.13% of stocks in our set.
- If you're looking for stocks that are quantitatively similar to BLUE FOUNDRY BANCORP, a group of peers worth examining would be FSTR, LIND, ZUMZ, LGIH, and ARES.
- To check out BLUE FOUNDRY BANCORP's SEC filings, go to the company's page on browse-edgar?action=getcompany&CIK=0001846017.
BLFY Valuation Summary
- In comparison to the median Financial Services stock, BLFY's EV/EBIT ratio is 5884.96% lower, now standing at -653.7.
- BLFY's price/sales ratio has moved down 3.1 over the prior 26 months.
Below are key valuation metrics over time for BLFY.
Stock | Date | P/S | P/B | P/E | EV/EBIT |
---|---|---|---|---|---|
BLFY | 2023-09-15 | 4.3 | 0.6 | -183.6 | -653.7 |
BLFY | 2023-09-14 | 4.4 | 0.6 | -185.5 | -656.1 |
BLFY | 2023-09-13 | 4.3 | 0.6 | -183.4 | -653.4 |
BLFY | 2023-09-12 | 4.3 | 0.6 | -183.6 | -653.7 |
BLFY | 2023-09-11 | 4.4 | 0.6 | -186.7 | -657.7 |
BLFY | 2023-09-08 | 4.4 | 0.6 | -185.7 | -656.4 |
BLFY Price Target
For more insight on analysts targets of BLFY, see our BLFY price target page. And for a list of of all stocks sorted by upside potential based on analyst target price, see our Top Price Target page.
Average Price Target | $14.00 | Average Broker Recommendation | 1 (Strong Buy) |
Blue Foundry Bancorp (BLFY) Company Bio
Blue Foundry Bancorp operates as a bank holding company for Blue Foundry Bank, a savings bank that offers various banking products and services for individuals and businesses. It offers deposits; and loans, such as one-to-four family residential property, home equity, commercial real estate, multi-family, construction, commercial and industrial, and other consumer loans, as well as home equity lines of credit. It operates 16 branches in Bergen, Morris, Essex, and Passaic Counties, New Jersey. The company was formerly known as Boiling Springs Bancorp and changed its name to Blue Foundry Bancorp in July 2019. Blue Foundry Bancorp was founded in 1939 and is based in Rutherford, New Jersey.
Latest BLFY News From Around the Web
Below are the latest news stories about BLUE FOUNDRY BANCORP that investors may wish to consider to help them evaluate BLFY as an investment opportunity.
Blue Foundry Bancorp Announces Adoption of Third Stock Repurchase ProgramRUTHERFORD, N.J., Aug. 17, 2023 (GLOBE NEWSWIRE) -- Blue Foundry Bancorp (NASDAQ: BLFY), the holding company for Blue Foundry Bank, announced that it has adopted a program to repurchase up to 1,268,382 shares of its common stock, which is approximately 5% of its outstanding common stock. This is the Company’s third stock repurchase program since completing its mutual-to-stock conversion and related stock offering in July 2021. The Company’s previous stock repurchase programs provided for a total |
Blue Foundry Bancorp Reports Second Quarter 2023 ResultsRUTHERFORD, N.J., July 26, 2023 (GLOBE NEWSWIRE) -- Blue Foundry Bancorp (NASDAQ:BLFY) (the “Company”), the holding company for Blue Foundry Bank (the “Bank”), today reported a net loss of $1.8 million, or $0.08 per diluted common share, for the three months ended June 30, 2023, compared to net loss of $1.2 million, or $0.05 per diluted common share, for the three months ended March 31, 2023, and net income of $40 thousand for the three months ended June 30, 2022. “Blue Foundry continues to main |
Blue Foundry Bancorp Schedules Second Quarter 2023 Earnings Conference CallRUTHERFORD, N.J., July 12, 2023 (GLOBE NEWSWIRE) -- Blue Foundry Bancorp (NASDAQ: BLFY) (the “Company”), the holding company for Blue Foundry Bank, announced that on the morning of Wednesday, July 26, 2023 it will release financial results for the quarter and six months ended June 30, 2023. A copy of the earnings release will be available on the Company’s website, https://ir.bluefoundrybank.com/, in the “News” section and at the SEC’s website, https://www.sec.gov/. Representatives of the Company |
Blue Foundry Bancorp Reports First Quarter 2023 ResultsRUTHERFORD, N.J., April 26, 2023 (GLOBE NEWSWIRE) -- Blue Foundry Bancorp (NASDAQ:BLFY) (the “Company”), the holding company for Blue Foundry Bank (the “Bank”), today reported a net loss of $1.2 million, or $0.05 per diluted common share, for the three months ended March 31, 2023, compared to net income of $562 thousand, or $0.02 per diluted common share, for the three months ended December 31, 2022, and a net income of $553 thousand, or $0.02 per diluted share, for the three months ended March |
Blue Foundry Bancorp Announces Adoption of Second Stock Repurchase ProgramRUTHERFORD, N.J., April 24, 2023 (GLOBE NEWSWIRE) -- Blue Foundry Bancorp (NASDAQ: BLFY), the holding company for Blue Foundry Bank, announced that it has adopted a program to repurchase up to 1,335,126 shares of its common stock, which is approximately 5% of its outstanding common stock commencing upon the completion of the Company’s existing stock repurchase program. This is the Company’s second stock repurchase program since completing its mutual-to-stock conversion and related stock offering |
BLFY Price Returns
1-mo | -11.39% |
3-mo | -16.91% |
6-mo | -13.49% |
1-year | -27.52% |
3-year | N/A |
5-year | N/A |
YTD | -34.63% |
2022 | -12.17% |
2021 | N/A |
2020 | N/A |
2019 | N/A |
2018 | N/A |
Loading social stream, please wait...