Bloomin' Brands, Inc. (BLMN): Price and Financial Metrics
BLMN Price/Volume Stats
Current price | $28.68 | 52-week high | $30.13 |
Prev. close | $28.64 | 52-week low | $22.03 |
Day low | $28.56 | Volume | 1,015,500 |
Day high | $28.98 | Avg. volume | 1,310,377 |
50-day MA | $27.43 | Dividend yield | 3.54% |
200-day MA | $26.04 | Market Cap | 2.50B |
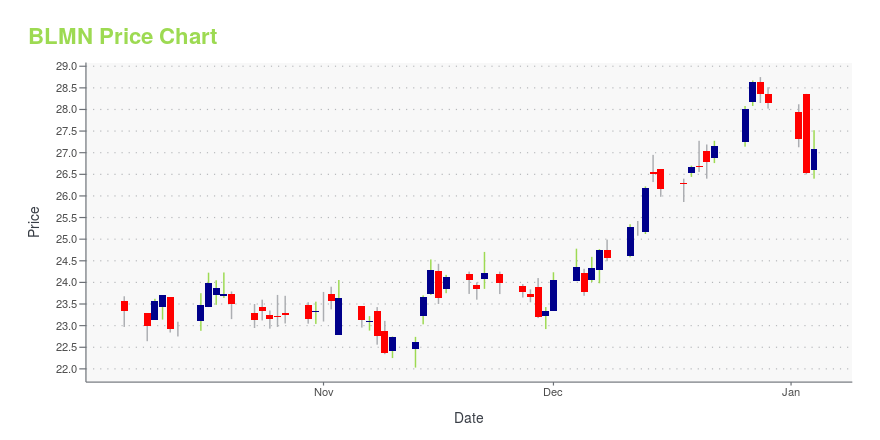
BLMN Stock Price Chart Interactive Chart >
BLMN POWR Grades
- Value is the dimension where BLMN ranks best; there it ranks ahead of 93.05% of US stocks.
- BLMN's strongest trending metric is Quality; it's been moving down over the last 26 weeks.
- BLMN ranks lowest in Sentiment; there it ranks in the 23rd percentile.
BLMN Stock Summary
- The capital turnover (annual revenue relative to shareholder's equity) for BLMN is 11.63 -- better than 96.65% of US stocks.
- Equity multiplier, or assets relative to shareholders' equity, comes in at 9.74 for BLOOMIN' BRANDS INC; that's greater than it is for 89.45% of US stocks.
- In terms of twelve month growth in earnings before interest and taxes, BLOOMIN' BRANDS INC is reporting a growth rate of 80.2%; that's higher than 87.59% of US stocks.
- If you're looking for stocks that are quantitatively similar to BLOOMIN' BRANDS INC, a group of peers worth examining would be GPRE, WHR, MFIN, WEN, and ENSV.
- Visit BLMN's SEC page to see the company's official filings. To visit the company's web site, go to www.bloominbrands.com.
BLMN Valuation Summary
- In comparison to the median Consumer Cyclical stock, BLMN's price/sales ratio is 37.5% lower, now standing at 0.5.
- BLMN's price/sales ratio has moved up 0.1 over the prior 139 months.
Below are key valuation metrics over time for BLMN.
Stock | Date | P/S | P/B | P/E | EV/EBIT |
---|---|---|---|---|---|
BLMN | 2023-12-29 | 0.5 | 6.2 | 9.3 | 13.0 |
BLMN | 2023-12-28 | 0.5 | 6.3 | 9.4 | 13.0 |
BLMN | 2023-12-27 | 0.5 | 6.3 | 9.5 | 13.1 |
BLMN | 2023-12-26 | 0.5 | 6.2 | 9.3 | 12.9 |
BLMN | 2023-12-22 | 0.5 | 6.0 | 9.0 | 12.7 |
BLMN | 2023-12-21 | 0.5 | 5.9 | 8.9 | 12.6 |
BLMN Growth Metrics
- Its 4 year net cashflow from operations growth rate is now at -24.29%.
- Its 2 year cash and equivalents growth rate is now at -75.73%.
- Its 2 year revenue growth rate is now at 6.37%.
The table below shows BLMN's growth in key financial areas (numbers in millions of US dollars).
Date | Revenue | Operating Cash Flow | Net Income to Common Stock |
---|---|---|---|
2022-09-30 | 4,368.543 | 390.788 | 104.561 |
2022-06-30 | 4,323.243 | 338.091 | 76.024 |
2022-03-31 | 4,275.447 | 408.564 | 222.204 |
2021-12-31 | 4,122.385 | 402.455 | 215.555 |
2021-09-30 | 3,887.807 | 388.124 | 140.645 |
2021-06-30 | 3,648.604 | 425.344 | 119.559 |
BLMN's Quality Factors
The “Quality” component of the POWR Ratings focuses on 31 different factors of a companies fundamentals and operational strength. Here are some key insights as we drill into the specifics of these quality attributes.- BLMN has a Quality Grade of B, ranking ahead of 85.71% of graded US stocks.
- BLMN's asset turnover comes in at 1.1 -- ranking 12th of 79 Restaraunts Hotels Motels stocks.
- CAKE, RRGB, and STKS are the stocks whose asset turnover ratios are most correlated with BLMN.
The table below shows BLMN's key quality metrics over time.
Period | Asset Turnover | Gross Margin | ROIC |
---|---|---|---|
2021-06-27 | 1.100 | 0.169 | 0.050 |
2021-03-28 | 0.937 | 0.125 | -0.011 |
2020-12-27 | 0.910 | 0.106 | -0.042 |
2020-09-27 | 0.955 | 0.117 | -0.030 |
2020-06-28 | 1.003 | 0.125 | -0.021 |
2020-03-29 | 1.121 | 0.149 | 0.015 |
BLMN Price Target
For more insight on analysts targets of BLMN, see our BLMN price target page. And for a list of of all stocks sorted by upside potential based on analyst target price, see our Top Price Target page.
Average Price Target | $34.63 | Average Broker Recommendation | 1.46 (Moderate Buy) |
Bloomin' Brands, Inc. (BLMN) Company Bio
Bloomin' Brands owns and operates casual, upscale casual, and fine dining restaurants under various concepts, including Outback Steakhouse, Carrabbas Italian Grill, Bonefish Grill, and Flemings Prime Steakhouse & Wine Bar. The company was founded in 2006 and is based in Tampa, Florida.
Latest BLMN News From Around the Web
Below are the latest news stories about BLOOMIN' BRANDS INC that investors may wish to consider to help them evaluate BLMN as an investment opportunity.
Bloomin' Brands (NASDAQ:BLMN) jumps 7.0% this week, though earnings growth is still tracking behind five-year shareholder returnsThe main point of investing for the long term is to make money. But more than that, you probably want to see it rise... |
Bloomin' Brands, Inc. (NASDAQ:BLMN) Looks Interesting, And It's About To Pay A DividendBloomin' Brands, Inc. ( NASDAQ:BLMN ) stock is about to trade ex-dividend in four days. Typically, the ex-dividend date... |
Bloomin’ Brands, Inc. (NASDAQ:BLMN) Q3 2023 Earnings Call TranscriptBloomin’ Brands, Inc. (NASDAQ:BLMN) Q3 2023 Earnings Call Transcript November 5, 2023 Operator: Good morning, and welcome to the Bloomin’ Brands, Inc. Third Quarter 2023 Earnings Conference Call. [Operator Instructions] Please note this event is being recorded. I would now like to turn the conference over to Tara Kurian, Vice President, Corporate Finance and Investor […] |
Bloomin' Brands (BLMN) Tops Q3 Earnings EstimatesBloomin' Brands (BLMN) delivered earnings and revenue surprises of 7.32% and 0.24%, respectively, for the quarter ended September 2023. Do the numbers hold clues to what lies ahead for the stock? |
Midday movers: Apple, Restaurant Brands, Paramount Global and moreInvesting.com -- U.S. stocks jumped on Friday after a cooler than expected job report for October stoked hopes that the Federal Reserve could be done with interest rate increases. |
BLMN Price Returns
1-mo | 4.42% |
3-mo | 2.75% |
6-mo | 18.88% |
1-year | 16.77% |
3-year | 10.07% |
5-year | 54.79% |
YTD | 2.75% |
2023 | 45.53% |
2022 | -1.65% |
2021 | 8.03% |
2020 | -11.09% |
2019 | 25.84% |
BLMN Dividends
Ex-Dividend Date | Type | Payout Amount | Change | ||||||
---|---|---|---|---|---|---|---|---|---|
Loading, please wait... |
Continue Researching BLMN
Want to do more research on Bloomin' Brands Inc's stock and its price? Try the links below:Bloomin' Brands Inc (BLMN) Stock Price | Nasdaq
Bloomin' Brands Inc (BLMN) Stock Quote, History and News - Yahoo Finance
Bloomin' Brands Inc (BLMN) Stock Price and Basic Information | MarketWatch
Loading social stream, please wait...