
Blend Labs, Inc. (BLND): Price and Financial Metrics
BLND Price/Volume Stats
| Current price | $2.87 | 52-week high | $5.53 |
| Prev. close | $2.84 | 52-week low | $2.63 |
| Day low | $2.84 | Volume | 74,854 |
| Day high | $2.87 | Avg. volume | 2,829,548 |
| 50-day MA | $3.38 | Dividend yield | N/A |
| 200-day MA | $0.00 | Market Cap | 745.23M |
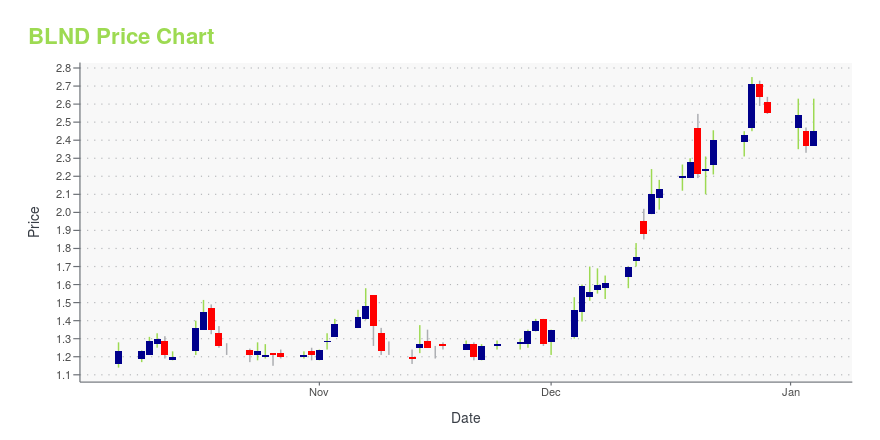
BLND Stock Price Chart Interactive Chart >
Blend Labs, Inc. (BLND) Company Bio
Blend Labs, Inc. provides cloud-based software platform solutions for financial services firms in the United States. The company offers a suite of white-label products for mortgages, home equity loans and lines of credit, vehicle loans, personal loans, credit cards, and deposit accounts. It serves banks, credit unions, fintechs, and non-bank mortgage lenders. Blend Labs, Inc. was incorporated in 2012 and is headquartered in San Francisco, California.
BLND Price Returns
| 1-mo | -14.84% |
| 3-mo | -20.94% |
| 6-mo | -28.07% |
| 1-year | -27.34% |
| 3-year | -7.42% |
| 5-year | N/A |
| YTD | -31.83% |
| 2024 | 65.10% |
| 2023 | 77.08% |
| 2022 | -80.38% |
| 2021 | N/A |
| 2020 | N/A |
Loading social stream, please wait...