
Blend Labs, Inc. (BLND): Price and Financial Metrics
BLND Price/Volume Stats
| Current price | $3.06 | 52-week high | $3.40 |
| Prev. close | $3.12 | 52-week low | $1.03 |
| Day low | $3.02 | Volume | 2,200,400 |
| Day high | $3.23 | Avg. volume | 1,990,864 |
| 50-day MA | $2.73 | Dividend yield | N/A |
| 200-day MA | $2.36 | Market Cap | 772.28M |
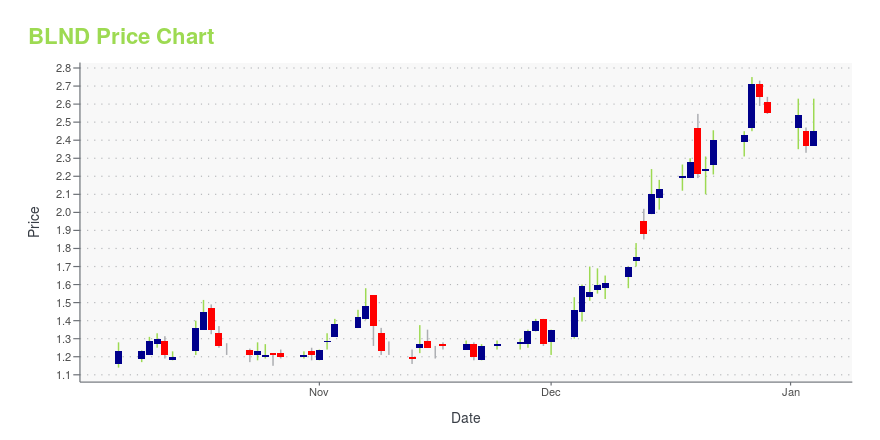
BLND Stock Price Chart Interactive Chart >
Blend Labs, Inc. (BLND) Company Bio
Blend Labs, Inc. provides cloud-based software platform solutions for financial services firms in the United States. The company offers a suite of white-label products for mortgages, home equity loans and lines of credit, vehicle loans, personal loans, credit cards, and deposit accounts. It serves banks, credit unions, fintechs, and non-bank mortgage lenders. Blend Labs, Inc. was incorporated in 2012 and is headquartered in San Francisco, California.
Latest BLND News From Around the Web
Below are the latest news stories about BLEND LABS INC that investors may wish to consider to help them evaluate BLND as an investment opportunity.
These Stocks Moved the Most Today: Pfizer, Etsy, Tesla, Vertex, Southwest, Take-Two Interactive, and MorePfizer’s guidance for 2024 disappoints, Etsy is cutting 11% of its workforce, and Tesla is recalling 2 million vehicles because of Autopilot control issues. |
Blend Named a Leader in Two IDC MarketScape Reports for North American Consumer LendingSAN FRANCISCO, November 28, 2023--Blend, a leading provider of cloud banking services, has been named a Leader in two IDC MarketScape reports – IDC MarketScape: North American Consumer Lending Customer Experience Solutions 2023-2024 Vendor Assessment (doc #US51322723, November 2023) and IDC MarketScape: North American Consumer Lending Decisioning Platforms 2023-2024 Vendor Assessment (doc #US51322623, November 2023). |
Many Still Looking Away From Blend Labs, Inc. (NYSE:BLND)With a price-to-sales (or "P/S") ratio of 1.8x Blend Labs, Inc. ( NYSE:BLND ) may be sending very bullish signals at... |
Blend Labs, Inc. (NYSE:BLND) Q3 2023 Earnings Call TranscriptBlend Labs, Inc. (NYSE:BLND) Q3 2023 Earnings Call Transcript November 7, 2023 Blend Labs, Inc. misses on earnings expectations. Reported EPS is $-0.17537 EPS, expectations were $-0.09. Winnie Ling: Good afternoon, and welcome to Blend’s Third Quarter 2023 Earnings Conference Call. My name is Winnie Ling, and I’m Head of Legal for the company. Joining […] |
Q3 2023 Blend Labs Inc Earnings CallQ3 2023 Blend Labs Inc Earnings Call |
BLND Price Returns
| 1-mo | 33.04% |
| 3-mo | 23.39% |
| 6-mo | 7.37% |
| 1-year | 133.59% |
| 3-year | -82.81% |
| 5-year | N/A |
| YTD | 20.00% |
| 2023 | 77.08% |
| 2022 | -80.38% |
| 2021 | N/A |
| 2020 | N/A |
| 2019 | N/A |
Loading social stream, please wait...