Bristol-Myers Squibb Co. (BMY): Price and Financial Metrics
GET POWR RATINGS... FREE!
BMY POWR Grades
- Value is the dimension where BMY ranks best; there it ranks ahead of 97.66% of US stocks.
- The strongest trend for BMY is in Growth, which has been heading down over the past 179 days.
- BMY's current lowest rank is in the Momentum metric (where it is better than 4.61% of US stocks).
BMY Stock Summary
- With a market capitalization of $155,571,152,590, BRISTOL MYERS SQUIBB CO has a greater market value than 98.77% of US stocks.
- Over the past twelve months, BMY has reported earnings growth of -281.92%, putting it ahead of just 5.61% of US stocks in our set.
- In terms of volatility of its share price, BMY is more volatile than only 2% of stocks we're observing.
- Stocks with similar financial metrics, market capitalization, and price volatility to BRISTOL MYERS SQUIBB CO are SNY, RTX, DE, NVS, and GILD.
- Visit BMY's SEC page to see the company's official filings. To visit the company's web site, go to www.bms.com.
BMY Valuation Summary
- In comparison to the median Healthcare stock, BMY's price/earnings ratio is 3.96% higher, now standing at 23.6.
- BMY's price/sales ratio has moved up 0.9 over the prior 243 months.
Below are key valuation metrics over time for BMY.
Stock | Date | P/S | P/B | P/E | EV/EBIT |
---|---|---|---|---|---|
BMY | 2023-01-20 | 3.4 | 4.8 | 23.6 | 24.6 |
BMY | 2023-01-19 | 3.4 | 4.8 | 23.5 | 24.4 |
BMY | 2023-01-18 | 3.3 | 4.7 | 23.0 | 24.0 |
BMY | 2023-01-17 | 3.3 | 4.7 | 23.0 | 24.0 |
BMY | 2023-01-13 | 3.3 | 4.7 | 23.1 | 24.1 |
BMY | 2023-01-12 | 3.3 | 4.7 | 22.8 | 23.9 |
BMY Growth Metrics
- Its 5 year revenue growth rate is now at 55.3%.
- The 4 year revenue growth rate now stands at 55.3%.
- The 5 year net cashflow from operations growth rate now stands at 158.02%.

The table below shows BMY's growth in key financial areas (numbers in millions of US dollars).
Date | Revenue | Operating Cash Flow | Net Income to Common Stock |
---|---|---|---|
2022-09-30 | 46,738 | 13,817 | 6,677 |
2022-06-30 | 47,144 | 15,396 | 6,617 |
2022-03-31 | 46,960 | 16,195 | 6,251 |
2021-12-31 | 46,385 | 16,207 | 6,994 |
2021-09-30 | 45,468 | 15,820 | -5,405 |
2021-06-30 | 44,384 | 12,773 | -5,079 |
BMY's Quality Factors
The “Quality” component of the POWR Ratings focuses on 31 different factors of a companies fundamentals and operational strength. Here are some key insights as we drill into the specifics of these quality attributes.- BMY has a Quality Grade of B, ranking ahead of 79.64% of graded US stocks.
- BMY's asset turnover comes in at 0.38 -- ranking 124th of 680 Pharmaceutical Products stocks.
- PAHC, ACUR, and XLRN are the stocks whose asset turnover ratios are most correlated with BMY.
The table below shows BMY's key quality metrics over time.
Period | Asset Turnover | Gross Margin | ROIC |
---|---|---|---|
2021-06-30 | 0.380 | 0.759 | -0.071 |
2021-03-31 | 0.353 | 0.744 | -0.072 |
2020-12-31 | 0.339 | 0.723 | -0.123 |
2020-09-30 | 0.307 | 0.713 | 0.062 |
2020-06-30 | 0.314 | 0.696 | 0.050 |
2020-03-31 | 0.334 | 0.681 | 0.058 |
BMY Price Target
For more insight on analysts targets of BMY, see our BMY price target page. And for a list of of all stocks sorted by upside potential based on analyst target price, see our Top Price Target page.
Average Price Target | $80.06 | Average Broker Recommendation | 1.47 (Moderate Buy) |
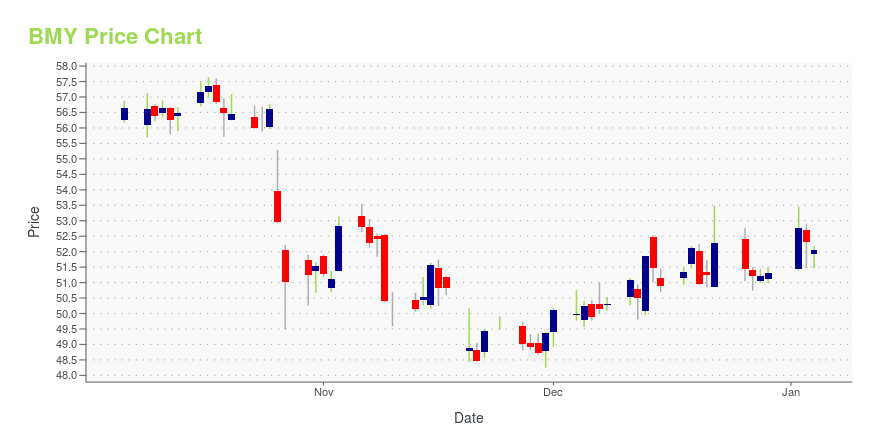
BMY Stock Price Chart Interactive Chart >
BMY Price/Volume Stats
Current price | $72.99 | 52-week high | $81.43 |
Prev. close | $73.17 | 52-week low | $62.35 |
Day low | $71.98 | Volume | 6,528,426 |
Day high | $73.20 | Avg. volume | 8,302,518 |
50-day MA | $75.37 | Dividend yield | 3.12% |
200-day MA | $74.48 | Market Cap | 155.19B |
Bristol-Myers Squibb Co. (BMY) Company Bio
Bristol Myers Squibb (BMS) is an American multinational pharmaceutical company, headquartered in New York City. BMS is one of the world's largest pharmaceutical companies, and is consistently ranked on the Fortune 500 list of the largest U.S. corporations. As of September 2020, it had the total revenue of $39.3 billion. (Source:Wikipedia)
Latest BMY News From Around the Web
Below are the latest news stories about BRISTOL MYERS SQUIBB CO that investors may wish to consider to help them evaluate BMY as an investment opportunity.
3 Buffett-Type Stocks to Buy Right NowWarren Buffett's Berkshire Hathaway has averaged 20% returns over multiple decades, and there isn't much mystery as to how it has done so: by investing in quality businesses at reasonable valuations. Three stocks that wouldn't look out of place in Berkshire's portfolio and that have qualities Buffett would desire include Bristol Myers Squibb (NYSE: BMY), TC Energy (NYSE: TRP), and PayPal (NASDAQ: PYPL). Healthcare companies don't normally take up a big share of Berkshire's portfolio, but one healthcare stock that was in there as recently as last year was Bristol Myers Squibb. |
Iovance (IOVA) to Buy Clinigen's Cancer Drug, Stock Up 11.6%Iovance (IOVA) to acquire worldwide rights to an IL-2 product already approved by FDA for two cancer indications. The deal is expected to close by first-quarter 2023. |
Bristol Myers Squibb (BMY) Stock Sinks As Market Gains: What You Should KnowBristol Myers Squibb (BMY) closed the most recent trading day at $73.26, moving -1.2% from the previous trading session. |
The Robert A. Winn Diversity in Clinical Trials Award Program Established by the Bristol Myers Squibb Foundation To Expand With Amgen’s Commitment of $8 MillionThe Robert A. Winn Diversity in Clinical Trials Award Program (Winn Award Program) established by the Bristol Myers Squibb Foundation (BMSF) announced that Amgen, a global biotechnology company, has committed to contribute $8 million over the next four years. |
bluebird (BLUE) Stock Dives on Public Offering of Common Stockbluebird (BLUE) to issue secondary shares, diluting its current shareholder base. The company plans to raise $120 million in gross proceeds from this issue. |
BMY Price Returns
1-mo | 1.32% |
3-mo | -4.25% |
6-mo | 0.47% |
1-year | 20.81% |
3-year | 25.75% |
5-year | 32.50% |
YTD | 2.25% |
2022 | 18.98% |
2021 | 2.88% |
2020 | 0.41% |
2019 | 27.74% |
2018 | -12.90% |
BMY Dividends
Ex-Dividend Date | Type | Payout Amount | Change | ||||||
---|---|---|---|---|---|---|---|---|---|
Loading, please wait... |
Continue Researching BMY
Here are a few links from around the web to help you further your research on Bristol Myers Squibb Co's stock as an investment opportunity:Bristol Myers Squibb Co (BMY) Stock Price | Nasdaq
Bristol Myers Squibb Co (BMY) Stock Quote, History and News - Yahoo Finance
Bristol Myers Squibb Co (BMY) Stock Price and Basic Information | MarketWatch
Loading social stream, please wait...