
Brenntag SE ADR (BNTGY): Price and Financial Metrics
BNTGY Price/Volume Stats
| Current price | $14.30 | 52-week high | $18.72 |
| Prev. close | $14.10 | 52-week low | $13.43 |
| Day low | $14.17 | Volume | 417,300 |
| Day high | $14.31 | Avg. volume | 22,625 |
| 50-day MA | $14.05 | Dividend yield | 0.05% |
| 200-day MA | $16.07 | Market Cap | 10.32B |
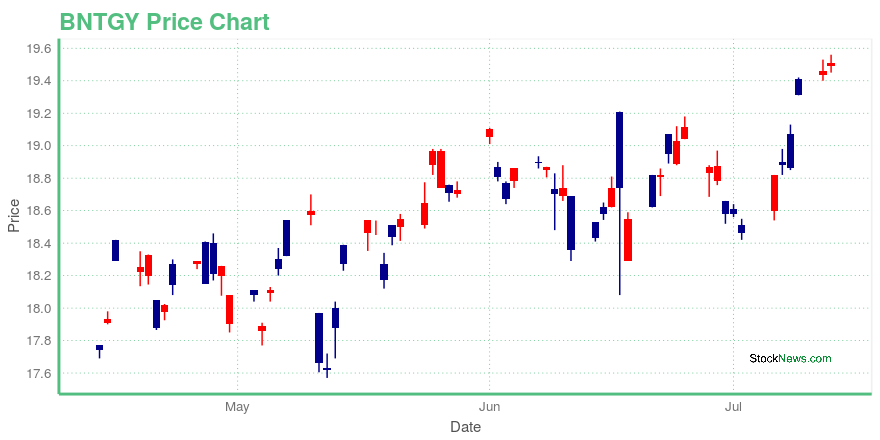
BNTGY Stock Price Chart Interactive Chart >
BNTGY Price Returns
| 1-mo | 4.92% |
| 3-mo | -10.47% |
| 6-mo | -17.68% |
| 1-year | -6.73% |
| 3-year | -27.21% |
| 5-year | 45.41% |
| YTD | -21.89% |
| 2023 | 44.33% |
| 2022 | -28.61% |
| 2021 | 15.97% |
| 2020 | 48.29% |
| 2019 | 26.25% |
BNTGY Dividends
| Ex-Dividend Date | Type | Payout Amount | Change | ||||||
|---|---|---|---|---|---|---|---|---|---|
| Loading, please wait... | |||||||||
Loading social stream, please wait...